Pivot Points Binary Options – Support and Resistance on Auto-Mode
Full Review of the Pivot Points Tool for Binary Options Trading
As traders, our job is to predict the next move of price. After all, that’s how we make our money, so we have to use any means necessary to identify that next move. There are thousands of indicators that can help, but Support and Resistance remains the bread and butter of Technical Analysis. Unfortunately, identifying real S/R levels is difficult for novice traders and this article aims to provide a solution to that problem: Pivot Points.
What are Pivot Points and how to use them?
Wikipedia explains Pivots the following way: “A pivot point is a price level of significance in technical analysis of a financial market that is used by traders as a predictive indicator of market movement”. The Pivot is calculated with the use of the previous day’s High, Open and Close and acts as Support if price is above it or as Resistance if price is below it. In plain words, the Pivot point will appear as a horizontal line on your charts and it will act as Support and Resistance. In addition to the main Pivot Point, there are several other levels which are usually marked S1, S2, S3 (below the main Pivot) and R1, R2, R3 (above the main Pivot). In case you are wondering: yes, there are indicators built for that and you won’t have to use any math to get the Pivots up on your charts (you will find the one I use on Meta Trader 4 at the bottom of the page). Here’s how Pivot Points look like:
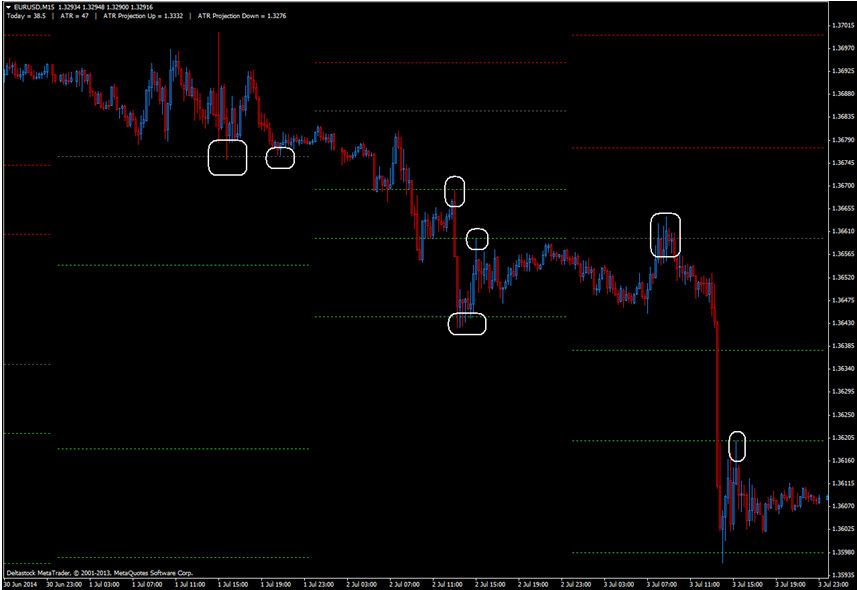
The grey dotted line is the main pivot while green lines are S1, S2, S3 and red Lines are R1, R2, R3. Notice how price reacts when the lines are touched (white rectangles): we can see several bounces off the pivots and also we can see how support turns resistance once it is broken. As a rule of thumb, if the day opens above the Pivot Point, price action for that day is considered bullish (an upwards bias) and if the day opens below the Pivot Point, traders usually have a bearish (downwards) bias. Of course, all this can change during the day if the Pivot is broken, but maybe a break of the Pivot holds some hints about price direction: it takes some strength for price to go to the other side of a S/R level (in our case the Daily Pivot) so chances are that once it does, it will continue in that direction.
The Time factor
Since the calculation of the Pivots is based on daily Open, Close, High, there will be slight differences based on your time zone. The generally accepted rule is that GMT time is used but some traders go for New York Open for calculation. Most Pivot indicators allow you to change the time zone and I use GMT but you should use what fits you better.
Why Pivots suck?
You’ll need trading knowledge to make the best out of Pivot Points trading. You can’t just slap some Pivot indicator on your chart and instantly become a great trader. Pivots by themselves don’t suck but they must not be considered more than they are. Don’t assume price will bounce always off of them or that a broken Pivot means that a new direction is established; price can reverse on a dime and that’s not the Pivot’s fault.
Why Pivots don’t suck?
They offer a “map” of price action and hints about where the market strength is. If price has been climbing for the most part of the day, R3 is touched and you see it lose steam, most likely a retracement is in order as the buyers start to lose strength. Same as Fibonacci levels, Pivot Points tend to be a “self fulfilling prophecy” because a lot of traders pay attention to them and that leads to some sort of reaction when price approaches them.
The Pivotal Conclusion
Observe price action when it’s close to the Pivot Points, usually it will give you some hints about price’s next move, whether it’s rejection or continuation of the initial impulse. One thing you must remember: don’t think of them as impenetrable walls; they are Support and Resistance levels and can be broken sooner or later. Trade Pivots the same as any S/R level. And one more thing (I promise it will be the last): Pivots are just a tool and should be incorporated in a trading system, not used on their own unless you are very skilled at reading Price Action… but then again, if you are very skilled at that, you probably knew already what I’ve just said.