Fibonacci. The Man, The Myth, The Math And The Method
Fibonacci is an important man in the world of trading, to know him is to trade profitably.
Fibonacci, A Traders Best Friend
Fibonacci. If you have been involved with trading for any length of time it is likely you have heard the name. Hell, if you’ve been to a basic math class you might have heard the name but do you really know anything about him? Sure, his numbers can be used to describe a lot of cool things in nature like the scales on the side of a pineapple, the branches of a tree and even the relationship of your own height with your arm-span. What many people don’t know is that the Fibonacci Sequence and the relationship between those numbers is a phenomenon that goes much further back in history than a quirky fellow from ancient Italy.
The Man Behind The Myth
Fibonacci was born Leonardo Bonacci in 1170 AD to wealthy parents living in Pisa Italy. His father, Guglielmo Bonacci, was an important man of the town and one of its leading merchants. He operated a port in north Africa where he often traveled with his son. While there both learned new ways of doing math, including the Hindu-Arabic numeral system we use today, and young Leonardo’s passion for knowledge was sparked. His greatest achievement is, in fact, the introduction and popularization of Arabic numerals in the book Liber Abacci. Liber Abacci, the Book of Calculations, changed the way in which numbers were counted including the use of 0 and place values. The power of this revolutionary new system was shown through practical applications such as bookkeeping, weights & measures and money changing.
One of the many things discussed in his book is what has come to be known as the Fibonacci Sequence. In the sequence each number is added to one before it to determine the next; 1, 1, 2, 3, 5, 8, 13, 21, 34, 55, 89, 144, 233, 377 and so on. While Fibonacci is credited with their modern use these numbers and their relationships to each other date back to the 6th century although some scholars believe the origins go back even further than that. In India the numbers were an applied ancient Sanskrit tradition, in the modern world the sequence is found repeatedly in nature, mathematics and the sciences. While there are many uses for the numbers the one of interest to traders is the relationships of the numbers to each other and their relationship to the Golden Ratio.

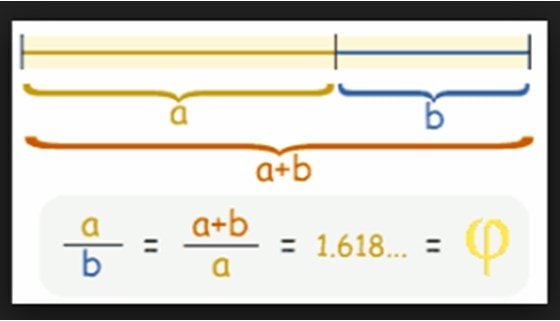
Two numbers are in the Golden Ratio if their ratio is equal to the ratio of their sum to the larger of the two. The equation looks like this; where a > b > 0, (a+b)/a = a/b = 1.61803…. off into infinity. The difference is that the relationship between the Fibonacci numbers and the Golden Ratio is that the Fibonacci relationship is really approaching the ideal, where the Golden Ratio is ideal, so there is always some discrepancy. For example, using the numbers 2 and 3 3+2/3 = 1.6666 repeating on forever and 3/2 =1.5. Going up to the next pair 5+3/5 = 1.60 and 5/3 = 1.6666 repeating. As you go up the chain, as the numbers get bigger, their ratio comes closer and closer to the ideal but never reaches it.
When you divide a Fibonacci number by its predecessor the answer will approximate the Golden Ratio and alternate with higher and lower numbers converging on the Golden Ratio but never quite equal it. In effect what happens is that the Golden Ratio, mathematical perfection, becomes the limit, from above and below, of the relationship between the Fibonacci Numbers and is in fact included in the Fibonacci equation.
The neat thing about the Golden Ratio and it’s the application to nature is that is found everywhere in nature and this includes the market. The market is made up of people and people are natural, organic. A group of people becomes a mob and mobs operate on an emotional, organic, level. The movements of the mob are subject to the laws of nature including the Golden Ratio. While the movements of the market will not exactly equal the Ratio, it will come close and can be explained by Fibonacci. These concepts are applied to a wide variety of trading tools, the most common of which is the Fibonacci Retracement.
The Fibonacci Retracement takes the measure of a major market move such as a rally, a bear market or established trading range and then breaks it down into target levels based on the Golden Ratio. What you will find when you use them is that they are an uncanny method of predicting the market, and more specifically, where you can find trading signals. The most important retracement level is the 61.8% (Golden Ratio is 1.618…) followed by the 38.2% (100% – 61.8%). The Quick Fib tool will automatically create retracement levels on your charts based on the most recent high and low and is a great tool for day traders. We have an active community of Fibonacci users that can be accessed in our forum.
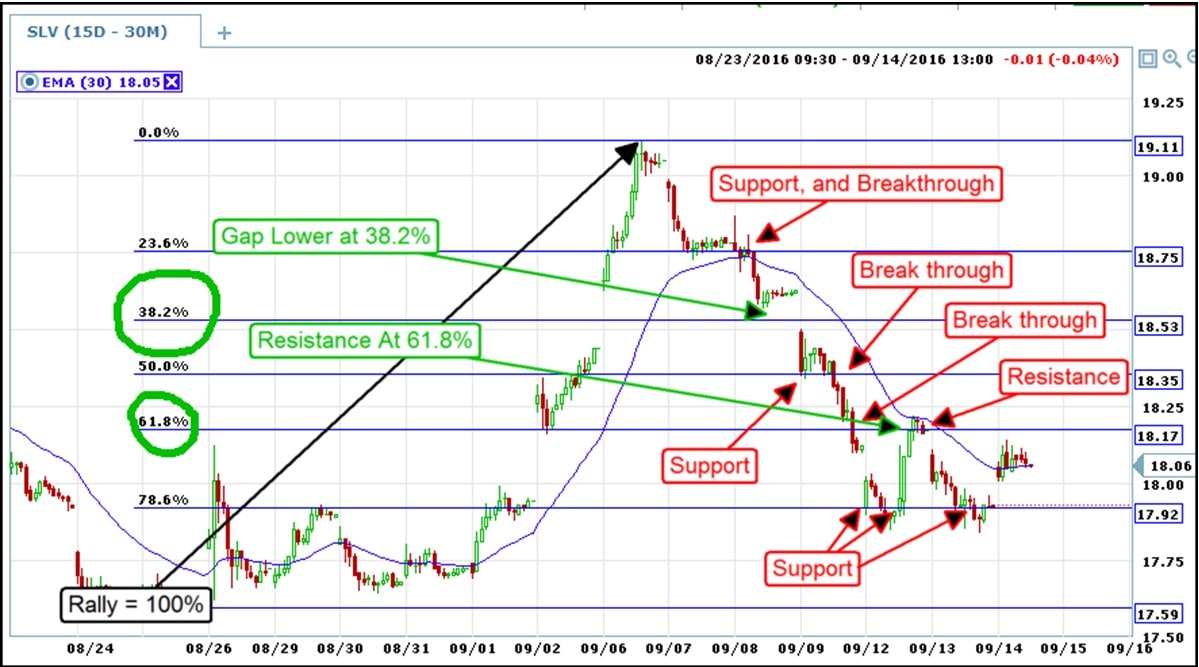
If you don’t believe me all you have to do is look at an older chart and apply the Retracement tool and you’ll see just how closely it predicts areas of support, resistance and where quality trading signals occur. I count a minimum of 11 high quality trading signals on this chart of silver prices, all centered on retracement levels. Note how there is a huge gap lower dropping past the 38.2% and then later resistance forms at the 61.8% level. Other tools that we will be reviewing include Fibonacci Arcs, Fibonacci Fans, Fibonacci Time Series and many others.
Fibonacci Retracements:
Fibonacci Retracements are the most basic form of Fibonacci Analysis. This tool measures the extent of a rally and projects potential support levels based on the Golden Ratio. The assumption is that the market is a living beast and moves it makes, particularly retracements of rally’s or snap-back rally’s in bear markets, can be predicted by the Golden Ratio. Important levels to watch are 38.2% and 61.8% but there are others.
Fibonacci Fans
Fibonacci Fans use the Golden Ratio to create potential trend lines based on retracement levels. The fans become support and resistance targets and indicate potential degrees of the trend for assets that are displaying bullish or bearish tendencies. This is how it works; in a bullish scenario use the Fibonacci tool to draw a line from the trough to the peak of a rally. The tool will then calculate retracement levels and project a trend line through that retracement level at the intersection of the peak. The fans can then be read and traded upon just like standard Fibonacci Retracements.
Fibonacci Arcs
Fibonacci Arcs are a little different from other uses of the Golden Ratio but still based on the same work. You start out the same, using the Fibonacci Tool to draw a line from the base to the peak of a rally, or the reverse in a downtrend. The tool measures this line and then creates a series of circles or arcs around the peak based on the Fibonacci ratios 38.2%, 50%, and 61.8%. The arcs are then used like other forms of Fibonacci to predict support/resistance, possible points of reversal and trends.
Fibonacci Time Series/Fibonacci Time Zones
Fibonacci Time Zones are projected points in the future, based on the Golden Ratio, where the market is likely to make a significant move or signal. Where other Fibonacci Tools measure the extent of a rally or decline the Time Zone tool measures the amount of time it took for the move to complete. These zones can be used to help time swings based on other forms of Fibonacci analysis.
Basic Rules For Trading Binary Options With The Fibonacci Method
The Fibonacci Method, which can be applied to any Fibonacci Analysis, except maybe the Time Series, is based on retracement levels. These levels are to be considered target areas where signals may occur, and can also act directly as support and resistance as well. The key to keep in mind is that where the signals occur relative to the retracement, arc, fan or zone is important to how it is read. For example, in a downtrend, if a signal occurs on the upper side of a retracement level it is more likely that support will hold but if the signal occurs on the underside that same level it is more likely the downtrend will continue.
The lines themselves are indications of strength or weakness and can be used as signals and targets. In the case of a retracement, either bullish or bearish, the first level is the strongest. This is 23.6%. If this level holds and the asset bounces in the direction of the original trend it is likely the trend will continue. If this level is broken a retracement to the next level, the 38.2% level, becomes likely. A retracement to this level does not necessarily indicate a reversal. A bounce from this level is likely to test resistance at the previous level. If resistance is broken next target is the previous high. If the 38.2% level is broken a move to the 50% becomes likely if that is broken a full retracement of the previous rally/bear market comes into play. It doesn’t always happen but the deeper the retracement of the move goes the more likely it will be a full retracement.
Fibonacci’s are also great for confirming other indicators. Moving averages, your own support/resistance lines, Bollinger Bands and many other forms of analysis are compatible as are oscillators like stochastic and MACD. You can use convergence and divergence signals to confirm retracement levels and vice versa. One really cool use of Fibonacci is to confirm each other. Take your favorite asset, find a decent rally or sell-off and then draw a Fibonacci Retracement, Fan, Arc and Time Series on it see what you find. I bet it’ll look a lot like mine where we can see some really nice signals forming at the intersections of these analysis. In my chart I only circled a few of the areas where Fibonacci is clearly influencing price action.
