Trading with the Weekly & Monthly Chart – Faster than 60 Seconds!
How to Make Best Use of the Weekly / Monthly Charts
Are you reluctant to begin using higher time frames? Don’t worry, you can still use the lower time frame charts too. Yes, even the beloved M1 chart! But in a much more efficient way. So, did I get your attention yet? I hope so, for your own account’s sake… Anyway, as I was saying; higher time frames will give you great insight about what is going on in the market and I can say it has improved my trading for sure. Now I would like to show you how you can make the best use of the weekly and the monthly chart. Before you proceed, I suggest you first read my article titled: “Using the Daily Chart – Higher time frame, Higher Accuracy!” It’ll fill you in on why analyzing higher time frames will lead to a higher success rate and about the interactions between the higher and lower time frames.
Monthly Chart – Getting the Big Picture
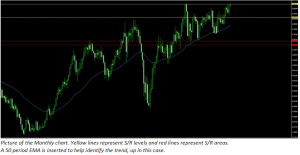
The first step is, you guessed it, recognizing important areas! Open up the monthly chart and take a look. Start by zooming out a bit you can identify highs and lows as far back as possible, as many years back as possible (usually 10-15 years is what you get in MT4). History matters so we want to make sure we don’t miss the action when price reaches historical areas or levels. Draw your support & resistance lines in relevant areas. Sometimes a single line is not enough for pointing out a specific level of support or resistance. This is why we have to distinguish between an area of S/R and a level of S/R. To pinpoint an area simply use two lines instead of one. I recommend using different colors for the “area lines” and the “level-lines”. This way you will avoid confusion. If you are only trading short expiries you might only need to plot the nearest highs and low that are of relevance. However, for those of you looking to take longer expiries such as ‘end of month’ and above, it’s wise to plot more lines. Next task is finding the trend. Simply draw lines from highs to lows or vice versa. Not so good with drawing trend lines? Just use one or two moving averages!
Weekly Chart – Time for Picking Entries!
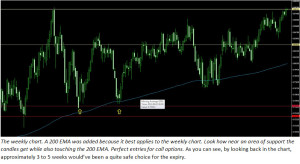
Now that we’ve identified the trend and major support/resistance levels and areas, it’s time to move down to the weekly chart. Here you can fine tune the S/R-lines that you drew on the monthly chart, adding more lines as necessary. It could also be a good idea to add yet another EMA with a longer period, 200 for example, because it’s well-adjusted to the weekly chart. You should also introduce the habit of checking back and counting the candles, this way you can get an idea of how much time is required for your signal to profit. Why not go down to the daily chart when you are done with the weekly chart and continue drawing lines to find better entries or to prepare for a short expiry trade, end of day or the hour for example. If you feel that the signals are not clear enough, go ahead and add one or two more indicators but don’t make the chart look too messy, you want to keep things simple and clutter-free. My choices would be Stochastic and RSI but you might have a favorite or two of your own. Test them and see how it plays out.
Impact on Lower Time frames
Suppose you have drawn lines on the weekly and monthly chart but you still wish to take shorter expires rather than the 3-5 weeks mentioned above. No problem! Simply go to the desired time frame and wait for the price to get to the support or resistance level that you drew on the weekly/monthly chart. If price is moving up towards a resistance level, you can take calls on higher lows going up with the trend towards that resistance level. If the resistance is reached and seems to be holding, you can take a put. Same goes for support levels. If a bearish movement is going towards a major support level, you can pick trades off of lower highs, going down with the trend. If support proves to be strong when reached, go for a call. This way you will benefit from these highly accurate and important support and resistance areas and levels even on lower time frames.
Conclusion – A Quick Way to Success
Overall, analyzing the weekly and monthly chart allows you to predict where major support and resistance areas will be so you can take advantage of them, whether you are trading short expiries, end of month expiries or a combination of both. When you get used to it, analyzing the weekly and monthly time frame will only take you a minute or so and it will greatly improve your trading. Combining this method of chart analysis with shorter term strategies is a great way to avoid unnecessary losses and frustrations. All too often an short term trader will fail to see the forest for the trees and place a trade too close to a long term area of potential reversal.
Further Reading:
- Using the Daily Charts – Trading Binary Options with High Accuracy