Using the Daily Charts – Trading Binary Options with High Accuracy
Using the Daily Chart – Higher Time Frame, Higher Accuracy!
Whether you prefer to trade shorter expiry or if you are a day trader you can improve your accuracy and knowledge of what is going on in the market by studying the daily charts! Some traders might think that it seems unnecessary to analyze a daily chart of an asset because they only trade 5-60 minute expiries, believe me, it’s not! Identifying the major trend using the daily chart will have a big impact on how well you perform – regardless of which lower time frame your signals are triggered on. In this article I want to show you how, using the daily chart, you can find highly accurate signals, excellent entries and pinpoint expiry. In my demonstrations I’ll use the chart of NZD/USD but you can also read about our pros analysis of other assets and major currency pairs in the following thread: CommuniTraders Action Room.
Step 1 – Recognizing Important Areas
I specifically used the word “recognizing” in the title because it means: “to know someone or something because you have seen or heard him or her or experienced it before” according Cambridge Dictionaries Online. Knowing an area on a chart, a price-level, is of importance because it works the same way. If you have seen how price acted the last time or the last 2, 3 or x’th time price came near or touched a certain level you recognize that and take advantage of it. Obviously you can find such significant levels on your chart by simply scrolling back in time or zooming out. Once you’ve noticed them you will simply mark them, using horizontal lines. These are our support and resistance lines and they will tell us where price is likely to head next! Take a look at the daily chart of the NZD/USD below.
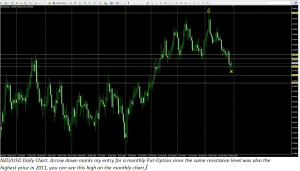
In this simple chart you can see some of the S/R-lines that I’ve drawn. The cross marks the last candle in May. However, most of my S/R-lines were already drawn back in April! As you can see, price touched ~0.85195 several times in April. I recognized this as an area of support. Hence, during May, I was expecting to take puts if this level would fail to hold. Once ~0.85195 broke, all I had to do was take puts all the way down to ~0.84750, which was the next area I had marked on my chart. As a day to day trader you could have either taken “end of day-expiry” trades or as a intraday trader you could have moved to a lower time frame and entered whenever prices made a high. Really savvy traders could have done both!
Step 2 – Inception, A trend inside a trend!
Remember the movie “Inception”, a dream within a dream inside a dream inside an… you get the point. Often trends work in the same way, while the daily chart displays a clear uptrend, the H4 chart for example, might be in a downtrend. In the movie, Leonardo Dicaprio used a Prop-Gyro to know whether he was in a dream or not. For us traders, the trend lines are the equivalent tool. If a trend line is broken we know we are out of the dream… I mean the trend! Trend lines can also help you find signals for entering trades.
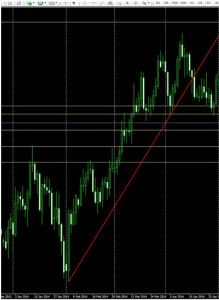
In the chart to the left, I’ve drawn a line going up, connecting two lows. Looks like a nice uptrend! Notice how price not only bounced off of the trend line but also bounced off of one the support-lines, 0.85195? Great place for taking a call option! Looking back at the previous low you could easily see that a weekly call could work perfectly here once price bounced back from support and the trend line, two excellent confirmations. After this new high was created price started to fall down. Let’s look at the next picture.
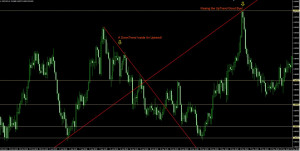
The red line going up from left to the right top is the same uptrend line as on the daily chart. Inside this uptrend a downtrend started to form on the H4 chart. The downtrend can be followed with the longer term trend line as a potential areas of support. Once that support gets broken it’s time to enter puts. Notice how the down trend line and up trend line intersect very nearly where price action confirms the break of support. Later prices moved back up but never got back up over the uptrend line. Instead, a bull candle touched an important resistance level which happened to be intercepted by the uptrend line! Then a bearish candle formed and now you know why I took a put there.
Conclusion – Accurate Signals No Longer a Dream!
If you understand the relevance of significant support and resistance areas on the daily chart you can maximize your profits and increase your accuracy. Having an idea of where price is more likely to move towards or from you can confidently trade in the same direction, whether you are choosing longer or shorter time frames. In the examples above I did not mention or include any indicators but I advise you to further confirm entries with indicators of choice. Target areas of S/R and go with the current trend. In the same vein, indicators and their signals that from on a daily chart can also be applied to your analysis in lower time frames. A stochastic cross on the daily chart means look for trend following signals in the lower time frame! History plays a big role, remember to look back now and then in order to locate previous support and resistance levels and use them to your advantage. I also recommend that you don’t remove S/R-lines that seem important because price tends to come back to the same area in the future, often several times. Overall, familiarize yourself with the charts and get used to drawing many many lines. Practice with them, see what they look like, erase them and drawn them again and again.