After the News: When is it Safe to Trade Again?
After the news, how long should I wait before I can trade again? We get this question often in the forums. Mostly they come from beginners that have just discovered news trading or read about the effect of fundamentals. If you have done your studies you should know that whether you are a technical or fundamental trader you must follow the news releases. That’s why you also need to know how long to wait before the markets are no longer affected by the news and your technical strategy is “good to go”. So, when is it really safe to trade again?
Different Fundamentals Result in Different Reactions!
You might have heard the good old; “wait 30 minutes after the news” or “you should wait at least an hour” from others. In my opinion, that approach is a gamble. Why not 23 minutes or 3.24 hours? Trust me, I’m speaking from experience. The “30 minute” rule has cost me money before so I know better. Different news have different impacts on the asset in question and should be carefully analyzed. Remember, prices are moving because of people in the market selling or buying the asset, driven by emotion fueled by news. This means that there is no rule holding them back from selling or buying the asset after only X minutes. News effects can last a whole day, week or even longer! In conclusion, the question should not be about how long you should wait. What you should ask is, what signs should I be looking for before entering a trade based on technical analysis after a news release?
4 Signs to Look for Before Trading After the News
#1 – Price is beginning to slow down, no “huge” candle jumps or drops. This is the first step because it will tell you about the volatility. High impact news usually add to the volatility of an asset and you will see big bull or bear candles for a duration of time as momentum carries asset prices to extremes. After X number of candles you will notice that the candles (bulls or bears) are becoming smaller because less people are buying and selling. This is the first indication it may be time to trade after the news.
#2 – A significant support or resistance is being reached. When the candles start to become smaller and also “slower” it’s usually because, as I mentioned above, fewer people are buying or selling. However, another reason could be that price is reaching a strong support or resistance line. Make sure to draw significant and valid lines that are drawn on H4 and above so you can notice where price is heading in advance and be prepared when candles begin to approach them. If asset prices are going to form a reversal or continuation signal this is most likely where. The is the second indication it may be time to trade after the news.
#3 – Analyze your indicators and use multiple time frames. If you observe that your indicators indicate oversold or overbought (depends on whether news pushed price up or down) on several time frames it is a good sign that news could be wearing off. The more time frames that are in agreement the better and I would not put my trust in M1 and M5 only. This is the third indication it may be time to trade after the news.
#4 – Check if Price was trending heavily before the news. If the asset you are analyzing was trending prior to the news release, there could be a big chance for a retracement or a correction if news made the price go against the main trend. This can provide trend following or reversal signals when combined with the first three tips. This is the fourth indication it may be time to trade after the news. Remember the more signals the better. Don’t rely on just one signal following the news because there is a higher chance it will be false while the bulls and the bears fight for control.
Example:
In this case I took a put option after the news made the EUR/USD drop and retrace back up! All the above rules applied for this trade. #1: Not only did prices slow down (compare that huge bearish white candle to others after it) but it started to move back up. #2: The price was heading for a strong weekly resistance that was support prior to the news candle breaking it. #3: Several time frames showed that the stochastic oscillator was overbought. #4: Price was in a down trend (see H4) prior to the news release and now making a lower high, thus signaling a put opportunity.
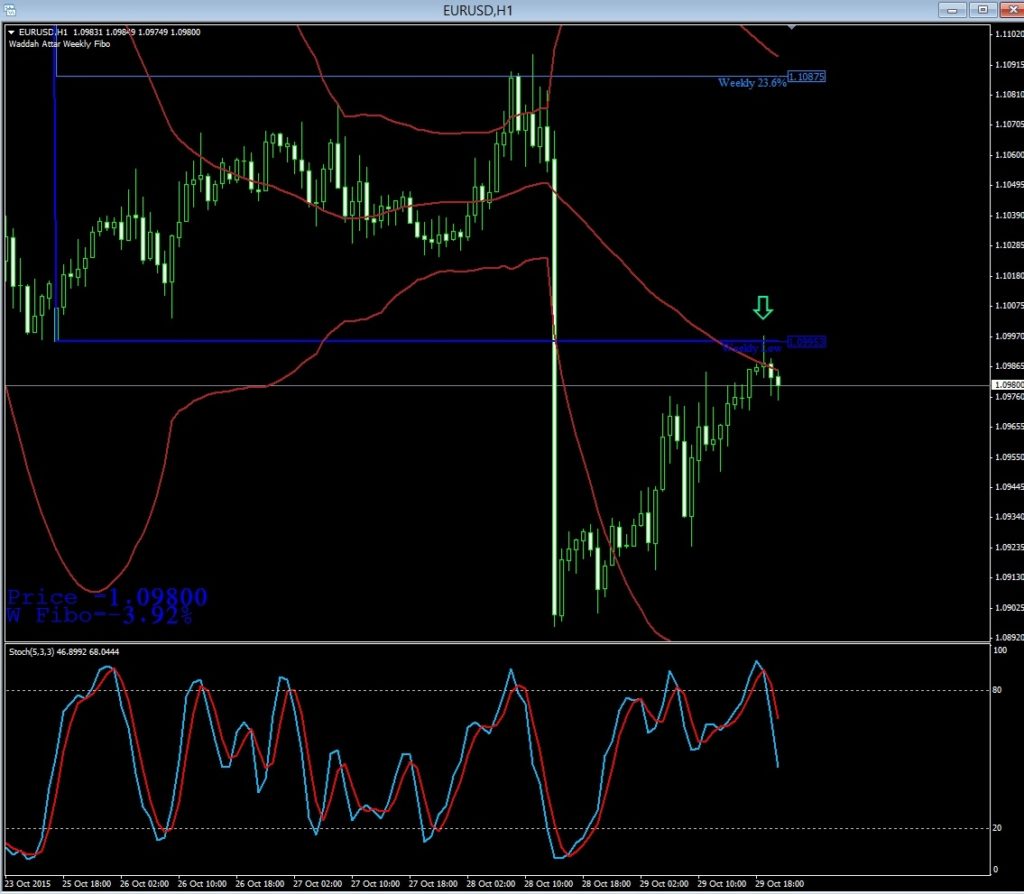
This is H2 of EUR/USD. If you scroll further back in your charts you will see that price was in a down trend on H4 and H1 even though in this small picture it was trending up slightly, prior to the news release. You should also look back in your charts and see if you can observe all the 4 rules!
Observe Methodically, Not Mechanically!
This is perhaps a much longer answer than you had expected to your question. Trading is complicated and you can’t make simple “mechanical” rules that will always work. These mechanical rules are such as: “always wait 30 minutes after news” or “always pick a 10 minute expiry for asset X” and similar rules will in the long run end up costing you many losses. Taking the methodical approach is the better way to go. The 4 rules above I gave you are not mechanical because they will differ from time to time and depend on your indicators of choice. They also depend on how you draw your S/R lines and where the trend is heading. So, how long should you wait? I say, don’t waste time sitting around waiting, spend your time methodically analyzing your charts and it will tell you exactly what to do!