The Geek’s Volume Weighted Moving Average Strategy – HomeMade
The Geek’s Volume Weighted Moving Average Strategy for Binary Options Review
I recently reviewed a tool called the Volume Weighted Moving Average Indicator. It determines an average price, weighted by volume obviously, that can be turned into a moving average. It relies on volume data which limits its use to stocks, commodities and forex pairs that include some form of volume data such as ticks, pips or actual share volume. I was surprised by two things by my review; first that I had never heard of this tool before and second just how amazing it was at shooting off signals when used with other moving averages. For my strategy I use two MA’s; an exponential and a VWAP all set to the same time frame.
What Is The Geek’s Moving Average Ribbon Strategy
My Moving Average Ribbon Strategy is a short term trading strategy using 2 different types of moving averages, all set to the same period. I use 30 days, or candles, bars what have you, but you can adjust it to any time period you like. The longer the time period the less signals, the shorter the time period the more signals. I like 30 days because it provides ample signals, in a timely manner, without too many whipsaws and false signals. The moving averages I use are the exponential moving average and the volume weighted moving average, also known as the VWAP or volume weighted average price. Together they provide different insights into the market, based on different criteria, and work well as a confirming/coincident indicator.
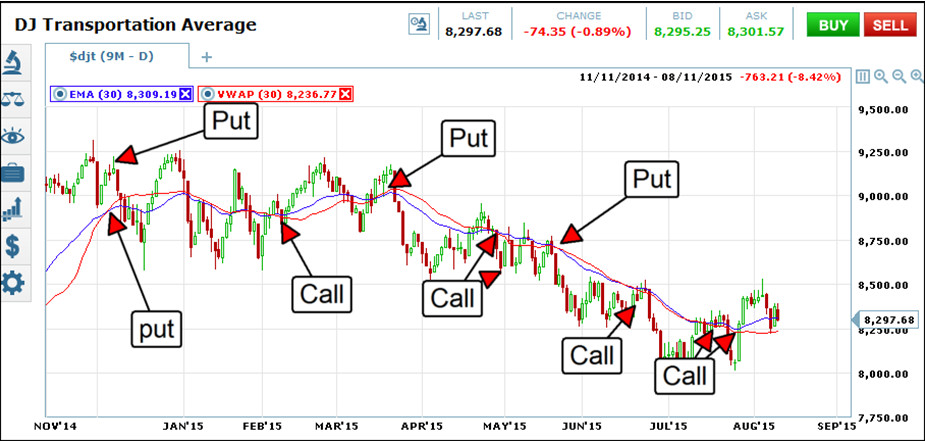
This is not intended to be a strict trend following strategy as it produces reliable signals in both directions. Naturally, in a strongly trending market trend following signals will be stronger. Range bound or choppy assets are also good targets but support and resistance need to be watched. Signals are no more complicated than a simple crossover. They generate whenever the exponential moving average crosses over the VWAP and are to be traded in the direction of the cross. Price can be either above or below the moving average, it doesn’t matter. In fact, the stronger reversal signals occur when the crossover diverges from price action. If price action crosses over while the averages are crossing over I suggest using a test of the averages for support/resistance be used for your entry. Expiry can be short, usually 2-5 candles is enough and this can be reduced by utilizing candlesticks to pinpoint the best entry.
Why This Strategy Might Suck
This strategy might suck for a couple of reasons. First, it is not trend following. I am usually a staunch observer of trends and a proponent of trading with them. Second, it is using a very simple signal and one not really confirmed by other indicators. Third, signals may not come too often, depending on which time frame you use. I have tested it on daily and 30 minute charts and found it may be several days between signals on the first, and up to four to six hours between signals on the second.
Why This Strategy Doesn’t Suck
It doesn’t suck, let me be plain. It is a simple simple strategy, based on a simple signal, but one with uncanny ability to produce reliable signals. At first glance it may be seen as just a moving average strategy but the VWAP is more than that. It encompasses volume as an indication of direction which helps to predict market reversals BEFORE THEY HAPPEN. The strongest crossovers are the ones that are divergent from price action and predict the strongest reversal. Simple crossovers that occur convergent with price are still very reliable but are to be seen as what they are, very short term trades. For best results I suggest using your own support and resistance lines as well, they can help weed out some of the false signals and even provide additional entries.
My Last Thoughts On The Volume Weighted Moving Average Strategy
I like this strategy for a number of reasons and think it is a good platform for additional analysis. The signals are clear, reliable and incorporate a host of information beyond simply averaging prices. It puts more weight on recent data than past data with the exponential average and includes volume data by way of the VWAP. This strategy is very basic and only targets one entry per signal but there are numerous other signals that pop up once the basic one has fired. For one, tests of the averages as support or resistance are additional entry points as are times when the EMA fails to complete crossovers. Adding in candle stick analysis is another great way to find even more signals but you can use mountain or h-l-c charts too.