Bollinger Bands and Momentum – The 60 Minute Strategy
Bollinger Bands and Momentum – When Volatility Meets Direction
Holy Grails anyone? Yes, I’ll have two please. A trader will work day in and day out, for as long as it takes to find the strategy we call Holy Grail, the sure money maker, the personal ATM machine. This strategy is often considered to be a 99% (… or higher) accuracy system but I think the real Holy Grail is the strategy which best suits you, the one you understand and are comfortable with and which makes you money constantly. Today I’m gonna review a strategy found on forexstrategiesresources.com, named “60 minutes Bollinger and Momentum” so you can decide for yourself if it has Holly G. capabilities.
How to use the 60 minutes Bollinger and Momentum strategy
This strategy uses two technical indicators found on Meta Trader 4. As the name suggests, the first one is the popular Bollinger Bands and the second one is not mainstream, but still well known: Momentum indicator. Both these indicators are available on the Meta Trader 4 platform, without any installation or extra fuss. If you need more information about Bollinger Bands, please follow the link above and hopefully you will find what you need. The momentum indicator offers clues about trend and the strength of a move. The original author uses the default settings for Bollinger and the Momentum is set to 11. This is a strategy created especially for Binary Options so an expiry is also recommended: 60 minutes (chart time frame is 15 minutes). Once you plot the indicators, your charts should look like this:
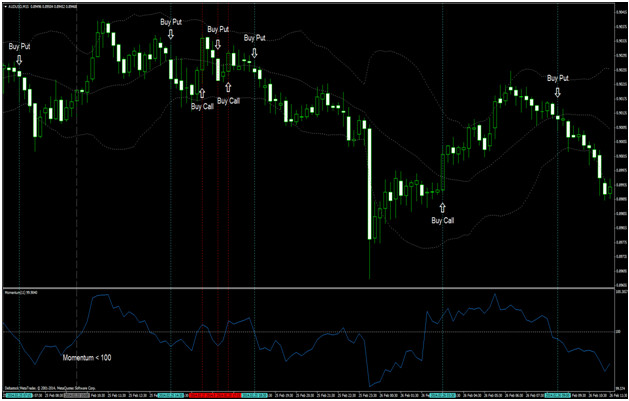
A trade is entered once price crosses the middle Bollinger band, if the Momentum indicator agrees and is on the right side of the 100 level (on the “right side” means above 100 for Calls and below 100 for Puts). So, to enter a Put we need price to cross the middle band downwards and Momentum to be below 100. The opposite applies for a Call: price has to cross the middle band upwards and Momentum to be above 100. Notice that on the picture above, I’ve drawn a dotted vertical line. In that place price crosses the middle Bollinger band but the Momentum is below 100 so we don’t take a Call; in other words, that is an example of trade which doesn’t meet all the conditions. Remember to wait for a middle band cross and Momentum above/below 100, agreeing with our trade direction. Here’s a summary:
Call entry:
- Price crosses upwards the middle Bollinger band
- Momentum indicator is above 100 level
Put entry:
- Price crosses downwards the middle Bollinger band
- Momentum indicator is below 100 level
Expiry time: 60 minutes. The chart time frame is 15 minutes so we have a 4 candle expiration time.
Why the 60 Minute Strategy Sucks?
My opinion is that Bollinger Bands are not used at their full potential because the strategy doesn’t take into consideration the distance between the bands. In volatile market conditions the bands spread apart and they contract when the market is slow. If you take a look at my picture above you will notice that the worst trades are taken when the bands are pretty close together, moving sideways and indicating the fact that the market is slow and ranging. When the market has direction, In the Money trades start to appear.
Why the 60 Minute Strategy doesn’t Suck?
Since the strategy was developed for Binary Options right from the start, the author also recommends an expiry time (which fortunately is longer than 60 seconds) and a chart time frame of 15 minutes. From my experience, a 15 minute chart will give you enough trades throughout the day while still keeping you out of all the noise present on a 1 or even 5 minute chart. Although the original author doesn’t take into consideration the distance between the bands, there’s nothing keeping us from doing it. The Bollinger Bands are great for gauging market volatility and do a good job at preventing us from entering when they are squeezed together.
Wrapping it up – Would I use it?
Frankly speaking, I wouldn’t use this strategy in its current form. I believe it doesn’t take advantage of an important feature of the Bollinger Bands and furthermore, the Momentum indicator never was one of my favorites. Then again, I didn’t use it that much so maybe my opinion is flawed. Bottom line is: I see some potential for this strategy, but it needs some improvements. If you have some great ideas regarding this one, let us know on the Forums. Good luck if you need it.
Liking this Strategy? Continue the 60 Minute Strategy Discussion on our Forum!