Double Trouble +1 Strategy. Chart Patterns Still Rule the Market?
Full Review of the Double Trouble +1 Strategy for Binary Options Trading
Most market veterans wouldn’t give up their price action style of trading for any indicator in the world. And why should they? After all, if that style makes money… keep doing what you’re doing. On the other hand, guys who rely heavily on technical indicators couldn’t trade without them as they would feel they’ll somehow lose their edge. But what if we were to combine the two styles, taking the middle road and using the best of both worlds? Maybe the answer is the Double Trouble +1 Strategy. Let’s find out.
What is the Double Trouble +1 Strategy and how to use it?
All technical indicators are derived from price, being simply an interpretation of it and that’s why indicators are best for showing us what happened, not what will happen. Of course we use them for their predictive powers but these are sometimes limited and I believe we should also use some form of price action if we want better results. But chart patterns, trend lines, channels, Support and Resistance levels, Fibonacci levels, price action in general is subjective to some degree and that’s why two people could see different things when looking at the same chart. In order to eliminate that subjectivity, I used for this strategy one of the most simple and clear chart pattern: the Double Top/Bottom. As you know, price doesn’t move in straight lines but instead creates tops and bottoms, peaks and troughs, highs and lows, valleys and mountains, call them whatever, they are the same thing. Maybe the easiest and less subjective chart pattern is the Double Top/Bottom: if price reaches the same level twice, you have a possible Double pattern. If price bounces the second time at the same level, the pattern is confirmed. Check out this pic for a clear Double Top:
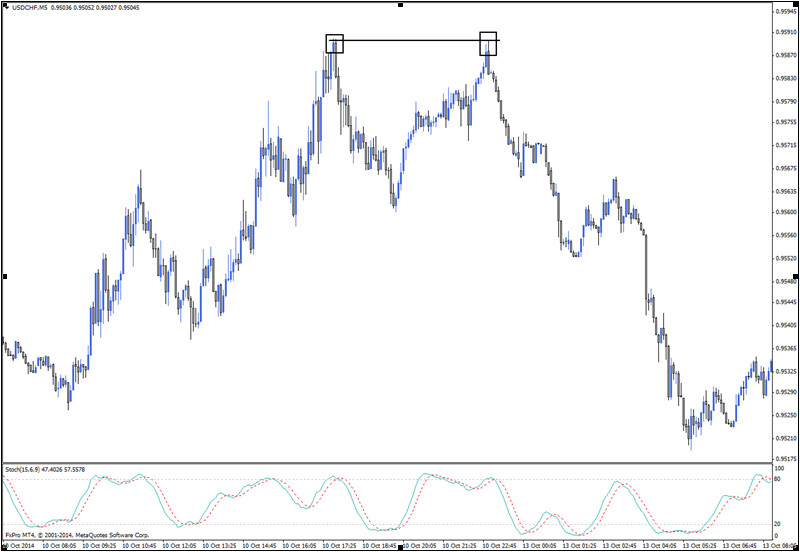
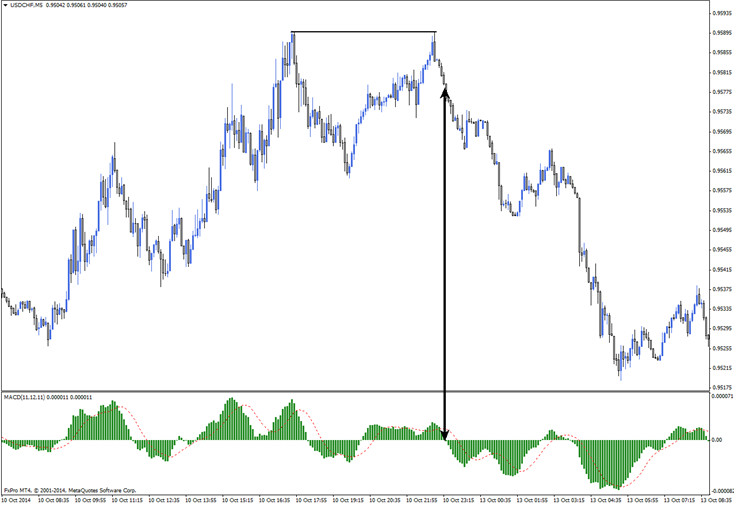
You don’t need to draw trend lines, channels or anything so there’s no subjectivity at all. If you can draw a horizontal line that connects the two tops or bottoms, you have a Double Top/Bottom patterns – self explanatory, really. Ok, with that out of the way, let’s see how we can trade this pattern. First of all you should know this is a strong hint of trend reversal, not continuation: price on the chart above is in a clear uptrend which ends with a Double Top and a downtrend begins. Second, because it is a reversal pattern we will need confirmation from an indicator – told ya we are going to combine price action and technical indicators – and this takes us to the “+1” in the name of the strategy. That “+1” means that almost any indicator of your choice can be used for confirmation. For example, on the chart above I have a Stochastic with settings 15, 6, 9 (you might know it from my other strategy, Getsuga Tensho) and I would enter a trade after that indicator comes out of overbought, confirming that we have a Double Top and that price will probably head down. However, you could use a MACD and go in when it goes below zero (after the Double Top is formed of course):
Or maybe even two fast Moving Averages:
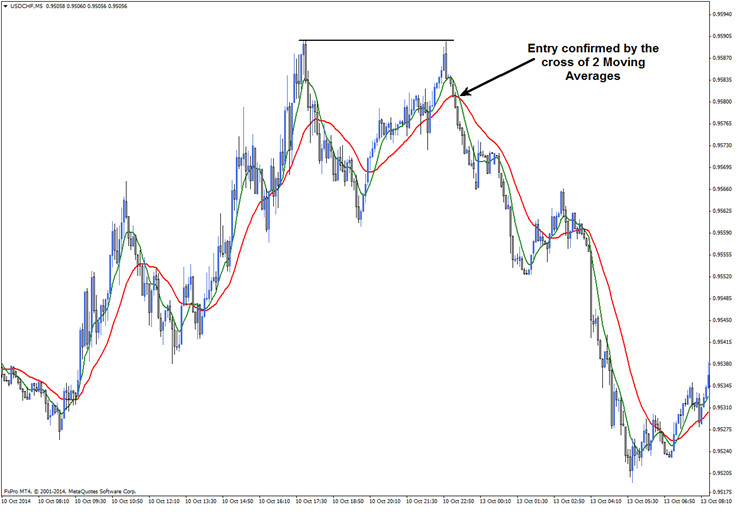
I could continue with more examples but bottom line is that “+1” is your choice. Take whatever indicator has worked for you, apply it to a Double Top or Bottom and see what happens. I believe you’ll like it, but there are a few things that prevent this strategy from being the Holy Grail so let’s see what they are.
Why does the “Double Trouble +1” Strategy Suck?
Maybe the main reason why it sucks is the fact that you will always trade counter trend with this strategy. The Double Top/Bottom is by definition a reversal pattern and this puts you against the trend, unless you take into consideration the higher time frames. You could go against the 5 minute trend but in the direction of the trend identified on a four hour chart; however, this would complicate things. Another thing that sucks about this strategy is the frequency of signals. The Double Top/Bottom is not something that develops 20 times a day and this will be frowned upon by thrill seekers who want to be always in a trade. Anyway, to me that’s not an issue.
Why the “Double Trouble +1” doesn’t Suck?
It’s simple and adaptable: you can use whatever indicator you want for confirmation and as for the Double Top/Bottom, I don’t believe that a simpler chart pattern exists. If you can draw a horizontal line between 2 points, you can identify this pattern. On top of that, I believe the Double is one of the most reliable chart patterns out there and that’s why I always look for it on my charts. No “suck” factor here!
Wrapping it up
If you see price stop at the same level twice, it means that something is happening there. Why did it stop in the first place? And the second time… hmmm, maybe it cannot go further and will reverse. Combine this pattern with pin bars, divergence and other technical analysis stuff and you’ll have a winner, my friend. However, my opinion is that a mechanical approach will not work for this strategy and the trader must add his own knowledge and view of the asset traded in order to make it work.