Multi-Conditional Strategy For Binary Options
This rather complex trading system uses moving averages and Bollinger band to identify entries during trending markets. It uses up to 3 time frames for verification and was originally posted on forex-strategies-revealed.com by Edward Revy. At first glance it seemed a little bit confusing but I soon figured out why, the approach is totally backward. However, I think this strategy can be used once it’s simplified and, corrected. On the plus side, I can tell already it can be used for binary options trading so don’t go anywhere and I will explain how!
How does the Multi-Conditional Strategy Work?
Before we get started you need to insert three moving averages; 14, 21 and 50 bars. These three EMA’s in are for trend identification and compliment the Bollinger Bands. Set the period to 20 for the Bollinger band and deviations should be 2. In this example the author uses three time frames; 5 minutes, 30 minutes and 1 hour candles. It’s wise to select a unique color for each EMA and the Bollinger band so you don’t get confused. Here is what your charts should look like:
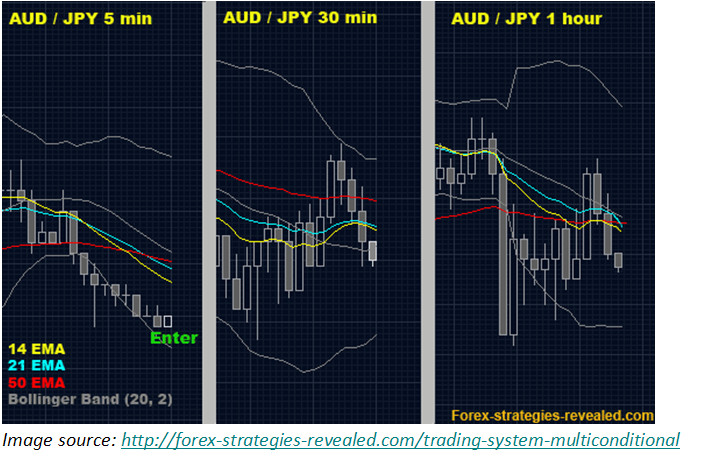
As you can tell from the picture above we need to observe three different time frames before taking any action. You will start with the 5 minute time frame and work yourself up to M30 and H2.
When the 14 EMA is above the 21 EMA and both of them are in turn above the 50 EMA and the 50 EMA is inside the Bollinger band, you should proceed to the M30 time frame. The same rule must apply on the M30 and the current candle must be a bullish (up) candle. From here, the author suggests that you can either take a call option or first make a third confirmation on the hourly chart.
The opposite rules apply for put options. Confirm a downtrend by analyzing the 5 minute chart. The 14 EMA should be below 21 and both of them in turn below the 50 EMA. Go to M30 and/or H2 and make sure the same exact rules are confirmed there with the addition of a bearish candlestick – then you take a put.
Call Entry Rules:
1. M5 time frame: 14 EMA is above 21 and both of them are above 50 EMA.
2. The 50 EMA should be inside the Bollinger band.
3. Go to M30 and H2, make sure the exact same rules are verified here too.
4. If a bullish candlestick is above the 14 or 21 EMA on the H2 chart you can take a call option.
Put Entry Rules:
1. M5 timeframe: 14 EMA is below 21 and both of them are below 50 EMA.
2. The 50 EMA should be inside the Bollinger band.
3. Go to M30 and H2, make sure the exact same rules are verified here too.
4. If a bearish candlestick is below the 14 or 21 EMA on the H2 chart you can take a put option.
Since this is a Forex strategy there is no information on expiries available. Luckily I have a suggestion for how you can choose the best expiry but first, allow me to make a recommendation. As I was browsing through the comments on forex-strategies-revealed.com I came across one that I totally agreed with. This commentator suggested that it would be much wiser to do things the other way around, by which he meant starting with the highest timeframe (H2) and then working our way down to the M5 for entry. I tried this on my own charts and it was a major improvement. As for the expiries, I would suggest up to two hours since we base our entry on the H1 candlestick!
Why Does the Multi-Conditional Strategy Suck?
This strategy can be very hard for a beginner to fully understand. Even after grasping how to use it, there are several indicators and rules to keep an eye on which can result in making mistakes. What I personally didn’t like was that we were supposed to analyze the charts starting with a lower time frame. It’s unusual and not recommended, in fact it’s totally backward from the norm. Bottom line, it may take hours for a signal to form this way and when it does the move is likely to be over.
Why Doesn’t the Multi-Conditional Strategy Suck?
Using moving averages to trade the trend and multiple time frames is a must for me. I always check them before entering any trades. I love the idea of getting trend confirmations using EMA’s and higher as well as lower time frames together, but not the way this guy suggests. This strategy is good because it follows specific rules and uses time frame to advantages, so long as you reverse the progression.
Multi-Conditional Strategy – Good Conditions for the Trader?
This strategy is a bit complex at first but once you’ve wrapped your head around all the rules and remember which colors on your chart represent which EMA’s you are pretty much good to go. Analysing different time frames is definitely something I recommend for any trader who wants to increase his success rate but I’m not sure this one will work as first explained. My problem is that the time frame analysis is backward. You should start with the higher time frame, and then work yourself down to the lower for good signals. Otherwise you will find a lot of frustration and spend a lot of time waiting for signals.