Do it Yourself! Build your Own RSIMA Binary Options Tool!
RSIMA – Build Your Own Binary Options Tool!
This morning I was looking for a tool to review – and I was looking hard ‘cause it seems to me that most of the mainstream tools/indicators have been already reviewed and explained. Then I went to mql4.com, figured I’ll find something there. No success. In fact I had some success: I found an indicator from the prettification category. Yea, I didn’t know that category existed either. You know what it does? It puts a lot of colored smiley faces on your charts… awesome. But because I know you don’t want smileys on your charts, I figured it’s time to show you how to build your own tool. We will call it RSIMA – true, the name sucks, I don’t like it at all.
Yes, this Indicator Really Exists!
First of all, I really need to show you the smiley face “tool”… just to see what you’re missing. Oh the money you could make with this one…
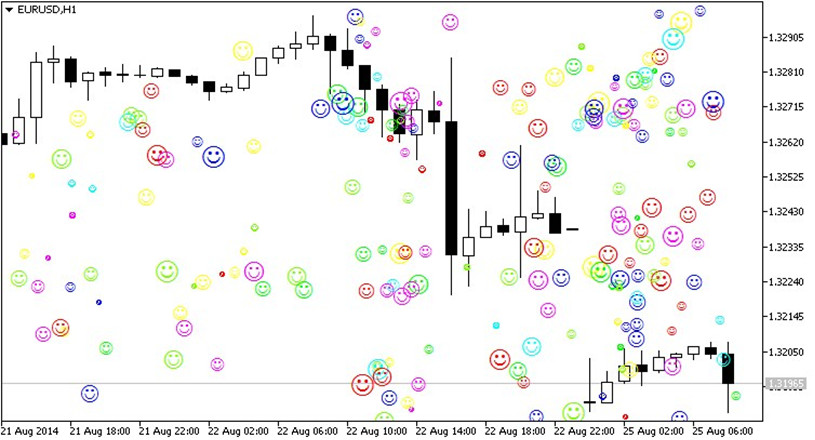
Yeah, that’s what I’m talking about. Trading has never been happier. With this indicator trading really becomes easy, exactly how all the Binary Options Brokers want to make us believe. And if you lost a trade, if you lost 10, if you lost the food or electricity money… just look at your charts and smile because it could be worse. This one goes out to all the “traders” out there who invest before knowing what a trend line is or before knowing who the broker they are dealing with is. It’s the perfect indicator for them so take it and use it. For those of you who understand trading is not as simple as some want to make you believe, keep reading.
What is RSIMA and how to use it
This tool is composed of two indicators: the Relative Strength Index (RSI) and the Exponential Moving Average (EMA); we will use the default setting of 14 for the RSI and 10 for the EMA. To build this indicator we will first attach the RSI to a chart. I am sure you know how because we’ve gone over it many times in the past. Ok, next open the Navigator (the tab with all the indicators), locate the Moving Average and drag it onto the RSI window. Do not drag it on the chat, but on the RSI window! Once this feat is accomplished, set the “Period” to 10 and “MA Method” to Exponential. You’re almost done; the last step is to select “Previous Indicator’s Data in the “Apply to” tab. The picture below will make it easier to understand.
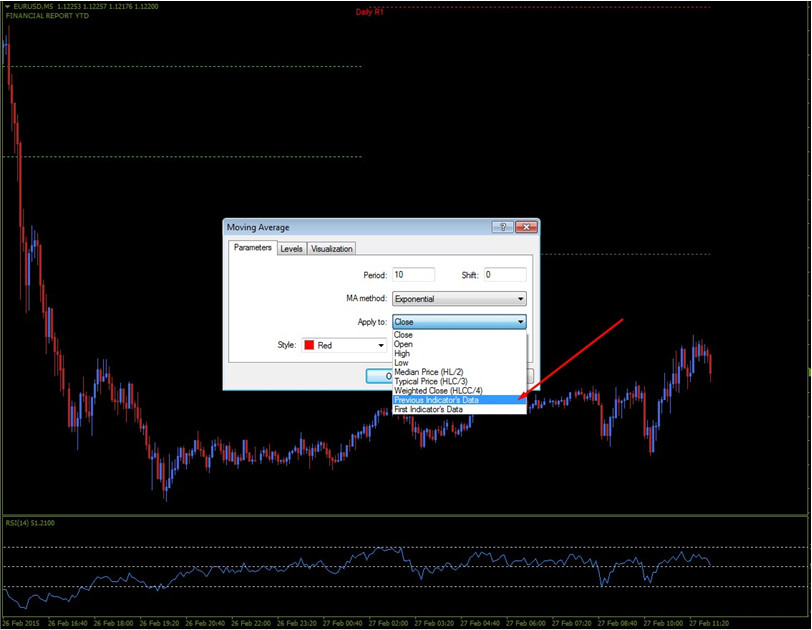
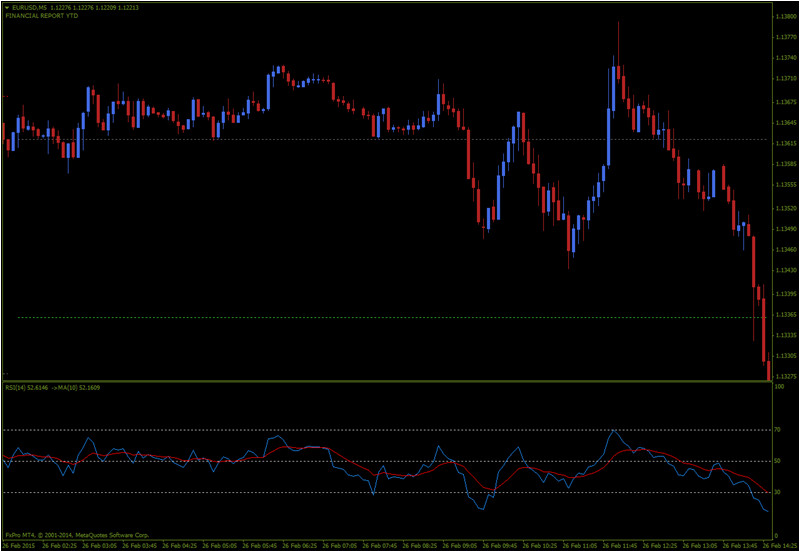
This procedure works for Meta Trader 4 and I am not familiar with the steps needed in order to build it for another platform. Once you’ve followed all the steps outlined above, here is what you will get:
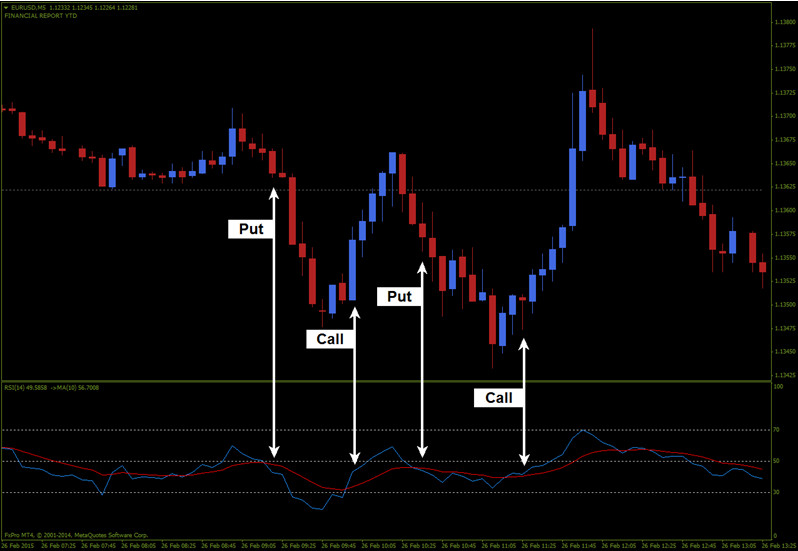
Now let’s move to the part where we learn how to actually trade the RSIMA. It’s pretty simple actually: the signal is generated when the EMA crosses the RSI and the two start to move nicely apart. Here is a zoomed in picture:
Why does the RSIMA suck?
Although in the picture above I showed you 4 profitable signals, in real life trading things will not always be so clear. Many times the indicator is mostly flat, with the EMA “hugging” the RSI. If you were to trade all the crosses when the market is very slow, you would probably end up losing money but that’s one of the reasons why I said you need to see the 2 indicators move nicely apart after the cross occurs. Wait for a candle or two to make sure it’s not a false cross and always keep in mind this is just a tool, not a complete strategy.
Why the RSIMA doesn’t suck?
It uses the features of the two indicators and the combination is better than using only one of them. The RSI is good for showing the Overbought or Oversold condition of the market and the EMA is good for identifying market direction and momentum, so if you see the RSI is oversold and the EMA starts to move north, crossing the RSI, a Call will have increased chances of success. Last but not least the indicator is pretty versatile because the settings of both the RSI and the EMA can be adjusted to suit your style of trading.
Wrapping it up
I said it before and I will say it again: do not use only one tool when you trade; look for confirmation from more than one indicator. If you like this indicator, try to fit it into your strategy and see if it improves it. Change its settings, test it, play with it but do not use it as a standalone tool.