The Pivot Scalping Strategy for Expert Binary Options Traders
Full Review of the Forex Pivot Scalping Strategy
This Forex pivot scalping strategy was brought to my attention in the strategy room by a beginner who wanted to use it for binary options but needed some guidance. I was skeptic when I saw the Parabolic Sar being included but further investigation revealed that you are required to analyze pivot points and not rely on a couple of indicators alone. Since I like pivot points I decided I would review this strategy in case anyone else is interested. The creator of the scalping strategy is Kelvin and he demonstrates how to use his Forex scalping strategy in this video. The scalping technique was intended for making trades that last only minutes in the Forex market, analyzing the five minute charts. If you consider yourself being a rather advanced trader with some prior experience you can give this a try.
What is the Forex Pivot Scalping Strategy?
I am sure there are loads of scalping techniques out there but this one uses pivot points which is the most important part of the strategy. Pivot is the average price and you can either calculate and draw them manually or use an indicator that draws them for you, if you are not confident enough yet.
Basically, these pivot points are support and resistance areas and their strength is measured by the number of candles that has touched them – the more the better. In the comments related to his video, Kelvin states that he prefers the daily fib levels. I believe he has a point because the daily charts are more accurate for determining strong support and resistance levels.
For extra confirmation, Kelvin suggests using two additional indicators for identifying overbought or oversold positions. He uses Stochastic Oscillator and Parabolic Sar both with standard settings.
The idea is to analyze the five minute charts and wait for the price to reach a certain pivot level that either acts as a support or a resistance. When price touches a support line, we are first supposed to observe that it repels the candles – Indicating support is strong. The Stochastic Oscillator needs to be oversold and the Parabolic Sar must draw dots under the candles. That’s our call signal. For put signals; the opposite is true. When price touches a resistance pivot level candles should be repelled and Stochastic overbought. This time, Parabolic Sar should paint dots above the candles. See a put scenario in the picture below.
Call Rules:
When support repels the candlesticks; confirm that dots are below the candles and that Stochastic is oversold.
Put Rules:
When resistance repels the candlesticks; confirm that dots are above the candles and that Stochastic is overbought.
My recommended Pivot Indicator:
Download Fibopiv_v2
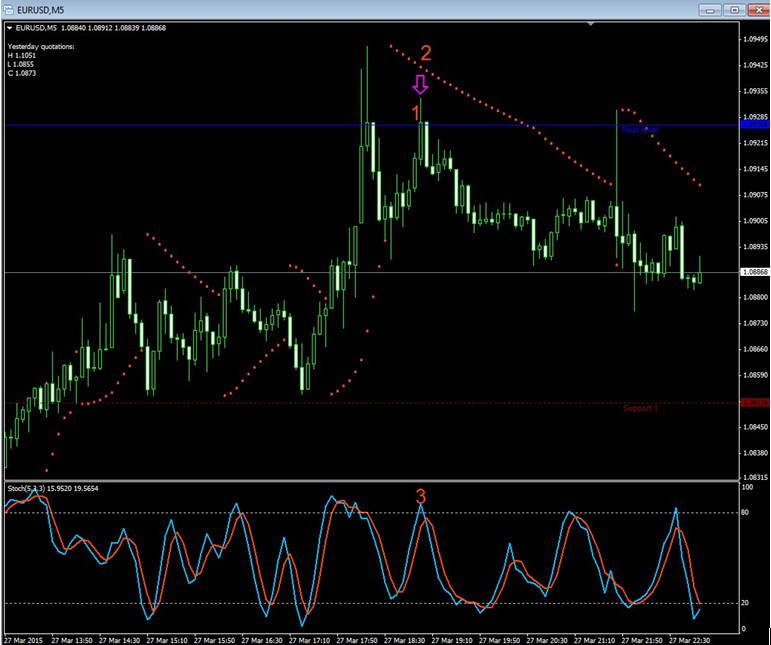
Notice all three rules are satisfied in this trade. 1) Price touched one of the Fibopiv indicators lines, blue one in this case and resistance held because the candle got repelled due to its wick. 2) Parabolic Sar indicates price is going down, dots are above candles. 3) Stochastic is overbought.
Remember that the heroes in this strategy are the pivot levels, the other two indicators are just there to confirm the signals.
Why does the Forex Pivot Scalping Strategy Suck?
This strategy sucks for anyone who is not familiar with support and resistance trading. Even with the Fibopiv indicator, you have to understand a certain level of price action or it won’t work. Another reason for why this strategy isn’t as good as it could be is the fact that Parabolic Sar is a repainting indicator. Meaning that a signal can be fake because the dots that appear can flip, indicating change of trend direction. Furthermore, a retracement can be far over when you get a valid Parabolic Sar signal because once you see the first dot, the Stochastic oftentimes already changed position from either overbought to oversold or vice versa. This is confusing, especially for beginners.
Why doesn’t the Forex Pivot Scalping Strategy Suck?
If you understand support and resistance lines then this strategy is a good start towards a more advanced trading technique. The Stochastic Oscillator definitely does not suck. It is a very strong indicator when it comes to identifying entry points. The Fibopiv is also an excellent tool if you want to level up and learn how to draw pivot lines on your own.
Final Words – Tsar Yes, Sar No!
I am not a big fan of the Parabolic Sar. I want to enter my trades at the best possible entries when the candles reach a certain support or resistance level. Waiting for the retracement to be over only to get a way too late dot signal from the Parabolic Sar seems unnecessary to me… The Stochastic Oscillator together with the Fibopiv make a great team already so if I were you I would get rid of the Parabolic Sar as soon as possible. I am sure you will do much better without it when you understand how to use the Fibonacci/Fibopiv levels to your advantage. Why not replace the Parabolic Sar indicator with something else; like your own favorite indicator? Still insist on keeping that repainting and slow indicator? Ok, at least try this whole thing on a higher time frame to see if the Sar performs better or not. After all, you are the Tsar of your strategy!
Have questions? Let’s discuss in the CommuniTraders strategy room.