A Moment with the Momentum Indicator for Binary Options
Full Review of the Momentum Index Tool for Binary Options Trading
The Momentum Indicator is a tool used for measuring the momentum, just as the name implies. According to Wikipedia, the “Momentum” refers to prices continuing to trend. The creator of this indicator is unknown but how it’s calculated is very simple. This indicator is an oscillator that identifies overbought and oversold areas while illustrating the strength of a trend. There are different ways of using the indicator and different periods to choose from. In this review I’m going to walk you through a couple of the most common ways of using the Momentum Indicator. So, let’s spend a… moment… to look at how we can take advantage of this indicator and whether it is any good!
What is the Momentum Indicator and how is it Used?
The indicator itself can be found in MetaTrader 4, click insert -> indicators -> Oscillators and locate “Momentum”. The default period is usually 12 or 14. According to Wikipedia, the Momentum indicator calculates the difference between today’s closing price and the close N days ago. Here is the formula! Looks simple right?
![]()
Formula from Wikipedia.
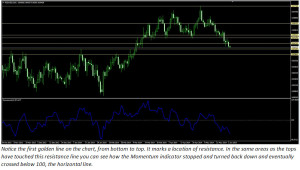
Well, it is that easy! If you look at a chart and add the indicator you will see how well the curves of the Momentum indicator follow the movement of the candlesticks. The indicator can be used alone to identify the current trend in relation to previous market conditions. A horizontal line can be added at level 100. When the Momentum line crosses above this line we consider the trend to be bullish. If the line is below the 100 line, the trend is considered to be bearish. Here is a picture of how it looks like, using period 14 with a line at 100.
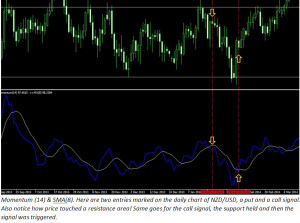
As I mentioned above, there are various ways this indicator can be used. Instead of the horizontal 100-level, you can add an SMA to the Momentum indicator and use crossovers as a sign for beginning of trends. For example; Momentum (14) and SMA (8).
Rules for Entry:
Puts: If the MI crosses below SMA from above it triggers a put signal, the trend is going to be bearish. Calls: If the MI crosses above SMA from below it triggers a call signal, the trend is going to be bullish.
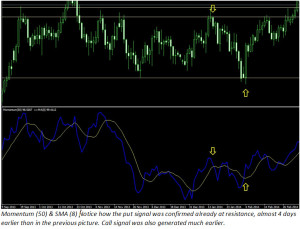
However, not so surprisingly, the signals got way more accurate and triggered much earlier on better locations when I changed the Momentum indicators period to 50 but kept the SMA(8). Compare the following picture to the previous one, above.
Why does the Momentum Indicator Suck?
If we only use the default values of the Momentum indicator the curves will look very choppy.
Choppier curves will result in fake signals. Furthermore, using the MI all by itself is not good for pinpointing accurate entries. The MI is a fast indicator, it displays whatever the candlesticks are doing and therefore it can trick you into thinking a trend is about to start. Although this tool can show you where a possible trend is about to start, you will have no idea how big the trend is going to be if you solely rely on this tool alone.
Why doesn’t the Momentum Indicator Suck?
This tool is very useful in combination with other tools. As I mentioned before, it’s commonly used together with other indicators. Using it with the SMA for example, will find you good spots to enter trades, riding with the trend. The indicator is easy to use and understand.
Conclusion: Use it, or not Worth Your Moment?
I can’t recommend anyone to use this tool without the support of other indicators. Also, I strongly suggest the use of support and resistance lines. As you observed in the pictures above, the S/R-lines helped to give additional confirmation that a reversal was about to happen. The lagging SMA works very well with the MI and triggers the signals much sooner than the horizontal 100-level does! The reason for this is that the SMA, on the contrary to the MI, is a lagging indicator. A lagging and a leading indicator work excellent together as they compliment each other. Changing the default period values of the Momentum indicator can vary the accuracy of the signals and the entries. Obviously, this tool can be used on time frames other than the daily chart. However, the periods for the SMA and the MI must be adjusted accordingly to fit the time frame of your choice. Remember though, lower periods mean more signals but also more fake-outs. In conclusion: the Momentum indicator can become the origin of a solid and working strategy for trading with the prevailing trend.
Further Reading:
- Bollinger Bands and Momentum – The 60 Minute Strategy
- The Trend Momentum High/Low Strategy – Germany’s Finest?