CCFP Indicator for Binary Options – Spaghetti or Dough?
CCFP – Spaghetti or Dough?
A trader’s tool box is constantly updated and new “toys” are added. At least that’s how I see it. I am always curious when I see a new indicator and even if it turns out to be a bad one, I test it to see how it behaves… on a demo account of course. I think I used or tested hundreds of custom indicators over the years and during this time I saw a lot of bad or just useless ones but there are some that really deserve their place in the trader’s toolbox. I believe the indicator presented today is worth taking a closer look so let’s see what it’s all about.
What is the CCFP and How to use it?
This indicator can be used only for currency trading and as we know, when we trade currency pairs, we compare one currency against the other. For example, when we trade EUR/USD, if the Euro is stronger than the US Dollar, the pair will go up and if the greenback is stronger, the pair will go down. Ok, but price on our charts is a graphic representation of the relationship between the two pairs so in a way, we just see the result of the battle between the two currencies in the pair: if the Euro wins the battle, price on our chart goes up and if the Dollar wins, price goes down. But what if we found a way to look at each currency individually? We would have an idea about the pair’s direction. Well, that’s exactly what this indicator tries to do: to show you the strength of each currency in the form of a line. It will look like this:

The Euro is represented by the Blue line and the US Dollar by the Green one. If you look at the Light Blue vertical line you will notice that at that time the Euro (Blue) was winning the battle and was sitting comfortably above the US Dollar (Green). And look what the pair was doing: it was moving strongly to the north. Later, when the greenback started to gain some strength (Green line started to move up), the pair begun to move down.
For us as traders those lines translate into Call on EUR/USD if the Blue line is above the Green one and Put on EUR/USD if the Green is above the Blue. Another way of using it is to watch for the cross between the two lines and consider an uptrend when Blue crosses Green to the upside and a downtrend when Blue crosses Green to the downside. Hoping things are not too complicated already, I am going to give you a hint about an early signal of reversal: notice what happens when the line corresponding to one currency reaches an extreme reading (very high or very low). Take a look at my Light Blue vertical line on the chart: at that time both currency lines were moving into an extreme position, very close to the top (and bottom) of the window. That’s an early sign that a currency exhausted its strength and it might start to move in the opposite direction.
As you can see, there are many uses for this indicator and it can also display up to 8 currencies in the same window. Anyway, I wouldn’t recommend using all 8 at once because your charts will look messy and hard to read. Here’s a picture showing the use of three currencies: Euro, US Dollar and Pound (Red):
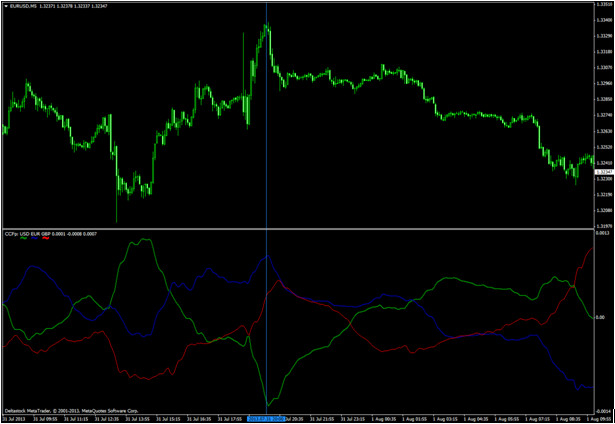
The picture is probably too small, but once you add the indicator to your charts, you will notice the color of each currency is indicated below its symbol.
Why does the CCFP Suck?
The indicator will look like a bowl of spaghetti and will get very hard to read if you add too many currencies and even if only 2 or 3 are used, the concept may seem too complicated to a newbie. But after all, we would all remain newbies if we weren’t curious and willing to learn so use it, try to understand it and eventually test it on a demo account.
Why CCFP doesn’t Suck?
It offers great insights at a glance about what happens inside the currency pair. Like I said above, the price which is represented on our charts is just the result of the war between the 2 currencies and the CCFP shows us the reason why price moved the way it did. Also, by comparing one currency against 2 or more, you will get a better picture of what’s happening, but that is reserved for more advanced traders.
CCFP – Currency Strength at a Glance
Some traders need exact signals like “Buy a Put if indicator X goes below indicator Y”. Well, the CCFP will not give you that kind of precise moment of entry but it will offer you a better understanding of price movement and currency strength. Although I consider it very useful, you must be aware that CCFP is just an indicator, a tool, not a standalone strategy and you cannot base your trades just on its signals. Furthermore, you have to understand how it behaves and use it to confirm or complement the signals coming from your strategy. There are many indicators similar to this one on the internet, each with different calculations but this one seems to be one of the most reliable for me so thanks to the guy who created it.
Downloads Available:
- CCFP Indicator for Binary Options Download
- Keep discussing the CCFP indicator on forum