The Geek’s Market Pressure Strategy For Binary Options – Newbie Friendly
Accumulation, Distribution And Binary Options Strategy
I recently reviewed the Williams Accumulation/Distribution Line tool and was impressed. I have not spent a lot of time with this class of tool, mostly because they are not generally great to use with short term trading like we do with binary options, but found that this one bears more attention. While researching my review I noticed some pretty decent signals and have since developed this little strategy to capture them. I will warn you, A/D lines are not good in short time frames such as 60 seconds, 15 minutes or even one hour, the line is just too choppy and erratic to be useful. This is a strategy best used on charts using 2H, 4H or 1D candles with expiry to match.
What Is The Geek’s Market Pressure Strategy
Market pressure, buying and selling, is often measure in accumulation and distribution. This pressure is displayed by several A/D line style indicators, this strategy is based on the Williams A/D Line Tool. Williams A/D line is based purely on price action, does not include volume in the calculation and produces a choppy line when compared to other A/D line tools like the Chaikin A/D line. This strategy is trend following and uses two tools, aside from price action, including a 30 day moving average. Support and resistance lines, Fibonacci’s, moving averages and other tools can be incorporated and will only help serve to reduce false signals and whip saws.
The first thing to do is to determine trend. This can be done a variety of ways and shouldn’t be too complicated. A cursory glance at the charts may be enough, if you need trend lines, moving averages or the A/D line itself can be used. If price action is moving higher over time assume an up trend, if it’s moving lower over time assume a down trend, if prices are moving sideways or obviously range bound the trend is sideways. In terms of the A/D line if it is above 0 the trend is positive, if it is below 0 the trend is negative, if it is either positive or negative and moving back toward the 0 line the trend is neutral. If the trend is up, only trade calls/bull signals. If the trend is down only trade puts/bear signals. If the trend is sideways, range bound or neutral you can trade both calls and puts but be careful of break outs and false signals.
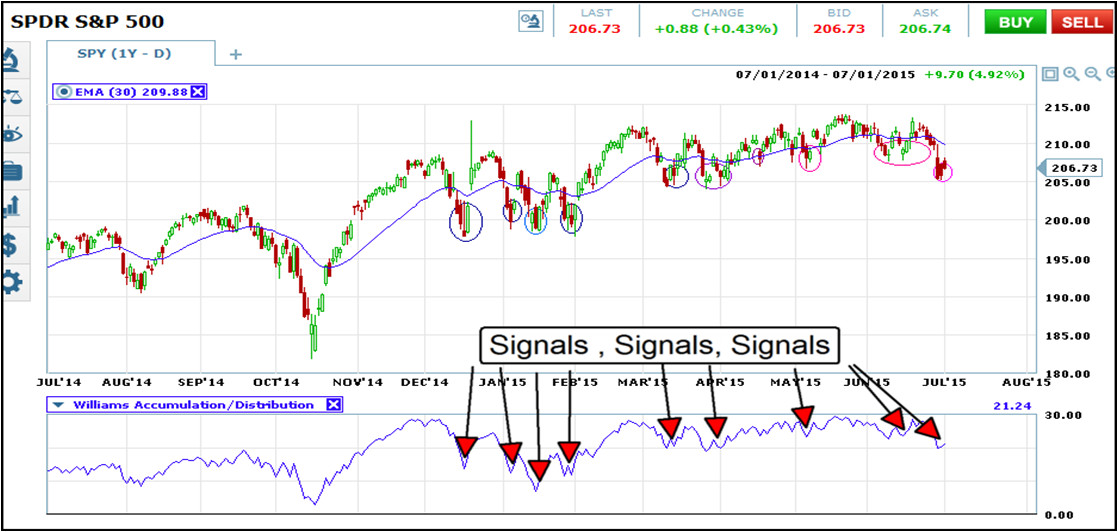
The signal occurs on any trend following tick in the A/D line after a corrective move. In the case of an uptrend this is when prices fall to or below the moving average. In the case of a downtrend this is when prices rise to or above the moving average. In the case of a range bound asset you will want to trade calls when prices are at the bottom of the range or moving higher and puts when asset prices are at the top of the range or moving lower. My recommended expiry is 3-5 candles following the signal candle which means one day to one week depending on which charts you are using.
Why This Strategy Might Suck
This strategy might suck because accumulation/distribution lines are not commonly used to derive trading signals. The tool is most often used to help determine trend, trend strength and potentials reversals. As a trend setting indicator it is as useful as any, when it’s above 0 the trend is in general positive, when it is below 0 the trend is in general negative. As an indicator of reversal it is so-so. It produces divergences that can be an indication of reversal but divergence is a sketchy signal to trade on regardless of the tool displaying it. In most cases these divergences can go on for quite some time before any kind of significant reversal takes place.
Why This Strategy Doesn’t Suck
This strategy doesn’t suck because it produces results, consistently. I don’t know how else to say it than that. When used in a trend following scenario the choppy nature of the tool is perfect for identifying movements near their point of origin. This is a significant improvement over most other trend following strategies that only hope to capture the middle portion of a movement, after the initial strong signal has been fired. The addition of the moving average is a crucial step in this strategy and one that helps cement its not sucky status.
My Final Thoughts On The Market Pressure Strategy
Honestly, I like this strategy. In my testing the signals are easy to spot and come with a high degree of reliability. At first I wasn’t using the moving average and the results were only so so. Once I added it it helped to differentiate between good entries and near term peaks which reduced the number of losses significantly. I also think it is simple enough to be used by a newbie with relative success. The A/D line itself is not great when used on low time frames which is one reason why. Signals that occur on higher time frames, especially on the daily chart, are much easier to spot and are more reliable than signals on shorter charts. The one thing that might keep binary traders from using it is that there are not a lot of signals, over the course of my 7 month test period I only found about a dozen signals, but they were dam good ones and produced greater than 75% success.