Accumulation/Distribution Line – New Way of Identifying Trends
Full Review of the Accumulation/Distribution Line Indicator
The Accumulation/Distribution Line, ADL, is a momentum indicator created by Marc Chaikin that measures supply and demand. The buyers are the accumulators and the sellers are the distributors, hence the name “Accumulation/Distribution”. This tool is mainly used for identifying trends and divergences and can be used together with other strategies and indicators for trading securities. In this review I’m going to explain how you can take advantage of this tool and what the drawbacks are. If you wish to deepen your understanding of how this indicator works you can read more on Investopedia.com.
What Is The Accumulation/Distribution Indicator?
This indicator is calculated by taking into consideration the closing price and the price range. You will find it under indicators->volumes-> Accumulation/Distribution in MT4. There is no need to adjust any levels or periods. First thing to notice is that the AD-line moves along with the trend, up in an uptrend and down in a downtrend making it easy to confirm a trend. Sometimes, however, a divergence occurs. For example, in a downtrend the AD-line starts to increase instead of declining. This indicates that the buyers are increasing and a reversal can be expected sooner or later. Depending on the time frame you need to give the signal some time to develop.
To get more accurate signals it is recommended to use at least one more indicator a long with ADL.
One such indicator is the Money Flow Index, which is quite similar to Stochastic Oscillator. Whichever you prefer to use the levels can be set to 20/80 where 20 is oversold and 80 is overbought.
Here is a picture with ADL and Money Flow Index.
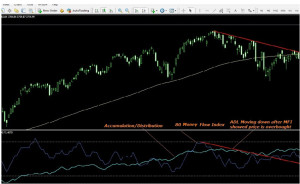
Daily chart of Nasdaq100, showing Moving Flow Index working together with the Accumulation/Distribution line (ADL). Notice when MFI hit level 80 price was overbought and the ADL started to decline. The decrease in price is marked by a red trend-line.
In my opinion the ADL becomes too choppy using lower time frames than M30 . Investopedia.com also suggests using both RSI and MFI to help improve the accuracy of the signals. Personally, I think support and resistance lines would come in handy, especially for confirming a reversal of the trend after the ADL starts showing signs of divergence.
Why Does The Accumulation/Distribution Indicator Suck?
First of all, this indicator by itself does not contribute much on its own. You can’t know for sure when the ADL will change direction if you don’t involve price action and other indicators. As for trading divergences it’s important to understand that fake signals will occur, ADL might signal a reversal by increasing while price is decreasing but a reversal does not happen. Also, it’s difficult to know when the reversal will take place without additional confirmation. Furthermore, the ADL ignores price gaps and can lure you to trade in the wrong direction. Here is an example of this gap-issue on Tradingview.com, scroll down to “Unreliability”.
Why Doesn’t The Accumulation/Distribution Indicator Suck?
This tool is perfect for identifying strong trends if used correctly with other indicators such as RSI, Stochastic, MFI and/or EMA. Since ADL helps finding divergences, it can also be a good way of improving a strategy that focuses on finding reversals. For beginners, the rules of using this indicator are easy to comprehend, up means up and down means down!
Conclusion – Accumulate The Strength Of Your Strategy!
My conclusion is that this indicator should definitely not be used solely by itself! It is extremely necessary to add more studies to the charts in order to understand what the ADL is saying. As mentioned above, RSI, Stochastic and Money Flow Index are all indicators that work well with the Accumulation/Distribution-line tool. Therefore, I suggest you use either RSI/Stochastic or RSI/MFI together with ADL. You should also introduce Price Action (S/R-lines) and trend-lines to enhance the signals given by ADL since it’s hard to determine duration for each trend that ADL confirms.
Back-testing can prove to be problematic because you can’t tell how long it took for a signal to be generated and how many fake-outs that had appeared before a solid signal was confirmed. That’s why it’s wise to try out this tool in accordance with your strategy on a demo account first.