Ultimate Trend Signals Review – Free Signals Could be Your Money Making
Ultimate Trend Signals can help you find reliable signals but you must use it correctly. This tool consists of several indicators and when they are in convergence you will get a powerful signal on your charts. I would say it’s both an indicator and a strategy, so let’s get down to business and see how does it work and how can you benefit from this tool.
You can download the Ultimate Trend Signals here
Ultimate Trend Signals – How Does It Work?
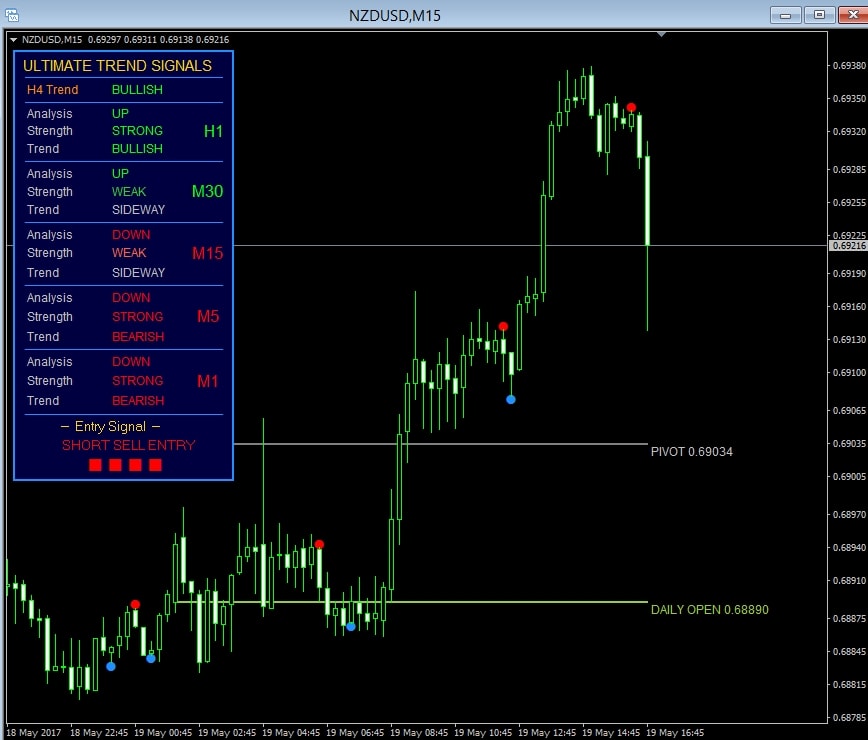
The Ultimate Trend Signals or “UTS”, uses three indicators to calculate a potential signal: MACD, RSI and Moving Average. Analysis concluded from those indicators are displayed for different time frames on the panel to the left on your charts. For example, if all time frames are in a bullish convergence, then the panel will give you a strong bullish signal written in green text. The caveat is that there can also be a mix like one or two time frames signaling for a bullish trend while others are bearish. The actual signal appears on the candlesticks themselves, displayed through a red or blue dot where red is for bearish signals (down) and blue for bullish signals (up).
To further help you interpret the direction of the price, a pivot (average support/resistance area) and a daily open level are drawn automatically by the Ultimate Trend Signals. You can use it on any time frame from M1 up to Daily but the lower timeframes such as M1, M5, and M15 give far more signals than H4 and Daily, obviously.
How to Use UTS – The Willy-Nilly Method For CFD, FX, Crypto and BO
Now that you know how it works, you need to know how to really use it. There are two ways, the amateur way, and the advanced way. Let’s start with the amateur one, the “Willy-Nilly” way as I call it. Basically, you get a dot and you trade – buy the pair, asset or coin you are trading when you see a blue dot and sell the asset when you see a red dot. As for Stop Loss and Take Profit – no need to worry, simply close the trade when another dot appears. The dots alternate – one blue, one red – so if you opened a Sell, the next dot will be blue and you close the trade whether you are in profit or loss.
If trading BO, red is for put and blue for call. What about expiry? Well, since I am describing the amateur way, the expiry is also poorly decided. Whatever time frame you are using, use the same amount for the expiry. Yeah, I told you, simple amateur way, do this at your own risk.
How to Use UTS – The Advanced Way For CFD, FX, Crypto and BO
This method is better suited for people with at least some basic technical charting skills so let’s set up some rules in order to make it easier for you. For example: 1) Don’t trade against the trend. 2) Plot a 50 EMA and don’t take bullish trades (Buys and Calls) when price is below it and don’t take bearish trades (Sells and Puts) when price is above it. 3) Draw support and resistance lines. 4) Draw trendlines. 5) If you are using the UTS on say the M5 charts then make sure at least M1, M5 and M15 are giving you a signal in the desired direction on the panel. 6) Pay attention to the Daily opening and Pivot line the UTS gives you – which side of the line are you trading, up or down? 7) If you are trading BO, use market-related expiries based on previous market movement instead of picking expiries haphazardly. If trading FX, CFD or Crypto, use proper Stop Loss placement and don’t be too greedy with the Take Profit.
Ok, here below is a great example of how to use the UTS properly and get winning signals – I used the M15 for this illustration.
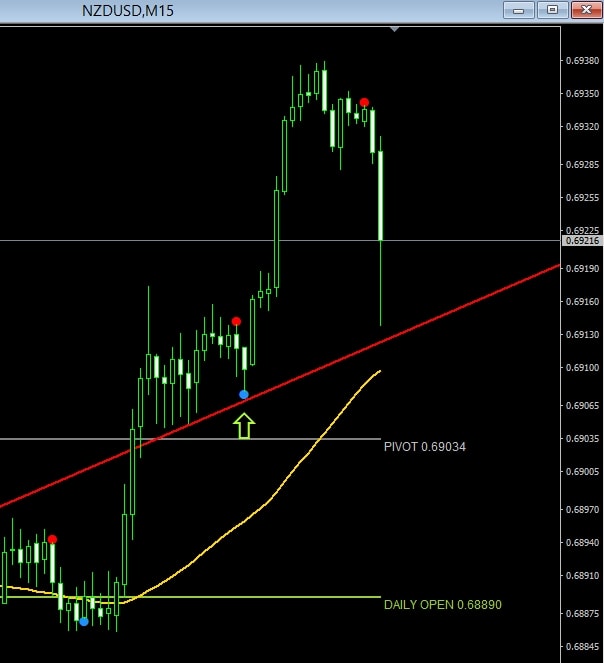
The above picture is the same timeframe and chart that you saw in the first picture. Here, I used a moving average 50 and price is above it and also above my trend line. You can also see the price is above the pivot level and trending up. Finally, we got the blue dot – thus signaling a bullish trade. In this case I would have used a 1:2 RR for Taking Profit and a tight Stop Loss just behind the trend line and the pivot line if I was trading FX, CFD or Crypto. For BO I would use a 30 minute expiry based on previous chart patterns.
Why Does The Ultimate Trend Signals Strategy and Tool Suck?
It doesn’t really suck. Why? Because it is collecting data using MACD, RSI and Moving Averages but also providing you with price action such as a pivot level and a Daily support or resistance. So it’s up to the user to also use his own brain and don’t use the willy-nilly strategy.
Why The Ultimate Trend Signals Strategy and Tool Doesn’t Suck?
Because as a good trader you will pay more attention to the price action and use the Ultimate Trend Signals tool for the confirmation. It won’t suck at all if you have some basic experience and you understand that this is no Holy Grail system. So do your homework first and learn a few charting patterns and charting techniques instead of giving full control to an indicator. This way you will be more successful.
Ultimate Trend Signals – Can’t Believe It’s Free!
Honestly, I can’t believe this thing is free and I think it’s the best free “signal tool” I have seen in a while! I have witnessed complete garbage and outright scam robots and indicators that cost blood money and this one is free! Of course, free isn’t always good but using some basic analysis as described above, this tool can become a killer strategy and even make you money. You may already know that I personally don’t like arrows and indicators telling me what to do but I will give this one a thumbs up. It does not mess up your charts either, all you have is the panel on the left and two horizontal lines so it’s clean enough for you to analyze the charts. That’s it, now there is only one way for you to find out if it’s any good or not – try it on a demo. Use the rules I advised for further improvement and don’t just jump in on every dot that appears! Good Luck.