Japanese Candlesticks Series – 7 Bullish Continuation Signals
I believe that knowing how to interpret a candlestick charts is a must for anyone who wishes to call themselves traders! Whether you are trading naked using Japanese candlesticks or simply following a strategy, you have to understand the basics. As traders, we deal with probabilities and therefore, we must absorb as much information as possible from our charts. Today, I wish to show you a few selected bullish continuation Japanese candlestick patterns. These formations show up during an uptrend and indicate the continuation of the uptrend. If you can identify them, you can tell that the bulls are still in charge and the price is very likely to continue its path up. You can also learn more about candles and these patterns by reading Bogdan’s article: Japanese Candles – The Sequel.
Types of Bullish Continuation Signals
1. Bullish Mat Hold
The first bullish continuation pattern is called Mat Hold and the formation is based on 5 candlesticks. The textbook formation consists of two bullish and three bearish candlesticks. When the first bullish candlesticks closes, with a bullish body, the following next candle will open slightly above the price of the first candle. This second candle will become a small bearish one, followed by another two short bearish candles. The Mat Hold is confirmed when the fifth candle, another bullish candlestick, closes higher above the previous four candlesticks. View the picture below!
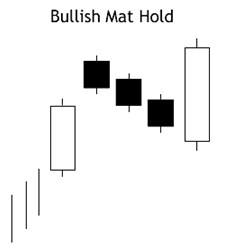
Notice the gap between the first bull candle and the first bearish (black) candle. Also notice that the last candle closes above all other candles. Indication a bullish continuation.
2. Bullish Rising Three Methods
This next candle formation looks similar to the above Mat Hold, at first sight. Five candles are involved to form this pattern as well. One bullish candle, followed by three bearish ones and lastly, another bull candle closing higher than all of the previous ones. The difference here is that the bearish candles fall lower than what we saw in the Mat Hold formation. However, they still stay within the body of the first bull candle.
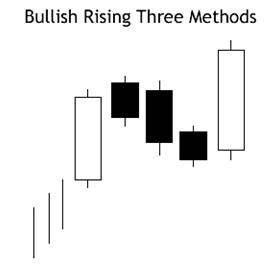
Notice the lack of a gap and that the bear candlesticks are falling lower than they did in the Mat Hold. Still, the last bull candle surpasses the previously reached price targets.
3. Bullish Separating Lines
This formation is based on two candlesticks. During an uptrend, a bearish candlestick will close and the next candlestick will open near or at the same opening as that bearish candle. This second candle must close all bullish, higher up. In which case, the continuation is confirmed!
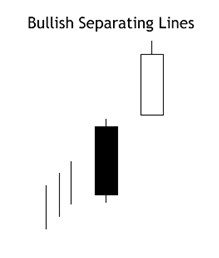
Notice the first candlestick is black = bearish and it closed further below. The next candlestick opened near/close to the opening of the black candle and closed bullish.
4. Bullish Upside Gap Three Methods
After a bullish candlestick is followed by another bullish candle that opened with a gap, the third candle should be a bearish one. It opens within the range of the second candlesticks body and closes below to cover the gap between the first and the second candlestick.
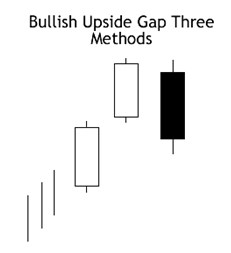
You can view this as a slight retracement down, before the uptrend continues once again.
5. Bullish Side-by-Side White Lines
This pattern is formed by only 3 bullish candlesticks. Candle number one is closed up and bullish and the next candle opens above it and closes even higher up. The third candle however, opens close to the previous candles opening price and closes at the same level too.
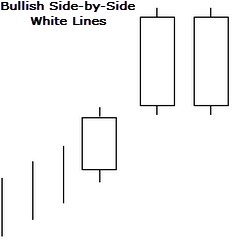
Notice that the second and third bull candle look the same.
6. Bullish Upside Tasuki Gap
This candlestick formation looks similar to the upside gap we discussed earlier. The difference is that the bearish candlestick in this case, does not manage to fully cover the gap between bullish candle one and two. Everything else is pretty much the same!
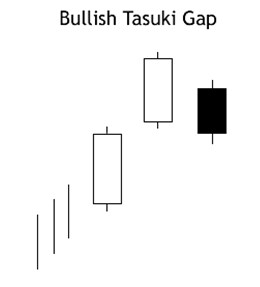
Notice that the bearish (black) candlestick is shorter than the one in the Upside Gap Three Methods. Hence, it fails to fill the gap.
7. Bullish Three Line Strike
This pattern can be observed once you have confirmed three in a row climbing bullish candles with higher openings and closes. The fourth candle should be a bearish one that falls below the first bullish candlestick. This indicates a quick “price dump” and gives room for buyers to enter the market once again and push the price up.
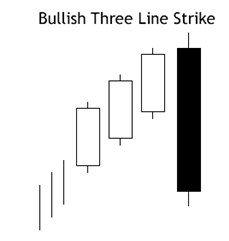
Notice that the bearish candlestick opened higher than the three bulls and closed further below them.
Conclusion – Bullish Continuation, Only in Uptrends!
It’s important that you understand that the chance for these formations to occur, is high only in an uptrend. After all, we are talking about bullish continuation patterns, so it should be obvious that you would look for them in clear bullish markets. I would also like to mention that your charts might not show you the exact textbook formations you saw from the pictures above. For example, sometimes there could be an extra candle or difficult to make sense whether you see “this or that” formation. Overall, if you don’t practice you won’t learn. So open up your charts and try to locate these patterns. You can analyze any timeframe you wish but I’m certain the higher time frames are the safest bet!
Further Reading On Japanese Candlestick Signals
- The Doji Signals
- Bullish Reversal Signals
- Bearish Candlestick Reversal Signals
- Bearish Continuation Signals