Japanese Candlesticks Series – 7 Bearish Continuation Signals
Japanese candlesticks are by far the best method for viewing financial charts. They help bring the data to life in way that is easy to read and provide signals for traders that produce results. Of course, not all signals are the same. There are bull signals and bear signals, continuation and reversal signals as well as long term and short term signals. This article is one in a series we’ve produced to help traders learn and identify only the best signals in order to make the most of this powerful trading tool. In previous articles we’ve explained what candlesticks are, Japenese Candlesticks – Trading Naked, and some of the basic one and two candle formation, Japanese Candlesticks – The Sequel. In this article I will go into more depth with multi-candle signals, specifically Bearish Continuation Signals, other articles in this series will cover reversal signals, doji signals and of course Bullish Continuation Signals.
Definition of Continuation Signal – A continuation signal is one that points to ongoing strength in a trend. A trend, in this case a bearish trend, is when prices move lower in a systematic way over time. A bearish continuation signal is one that indicates that the bearish trend is healthy, intact and that prices are heading lower. They can be as simple as one candle, but the most powerful such as the ones in this review often require 3 or 4 candles for confirmation.
Types of Bearish Continuation Candlesticks
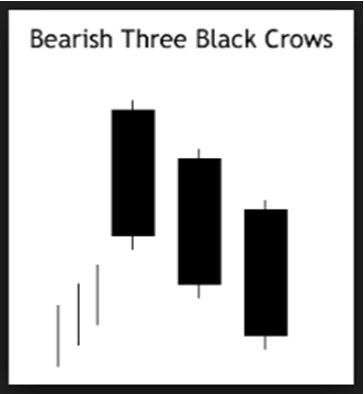
1. Three Black Crows
The Three Black Crows is one of the most easily recognizable of all bearish continuation patterns. It is in fact the bearish version of the Three White Soldiers, the bullish continuation patter, and created in a near identical fashion. The difference is that the “three soldiers” or crows are long black candles, longer than average, that appear one after the other. These can form at the top of a trend, just after the reversal, or during a trend and have the same meaning in either case; bearish sentiment is strong and lower prices are on the way. Additional signs of strength occur when this pattern confirms a resistance level, breaks through a potential support or comes with high volume.
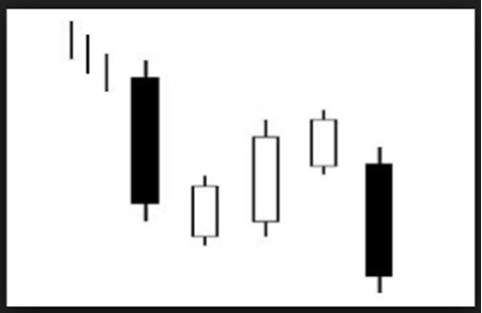
2. Falling Three Methods
This is bearish pattern is also a mirror image of a bullish continuation pattern, the rising three methods. Despite the name it is in fact a 5 candle pattern, not 3, and formed when a strong black candle is followed by three small candles, white or black, that slowly rise within the body of the first. The 5th and confirming candle is another long black candle that opens below the open of the first, and closes below the low of the first. The pattern is in fact two signals; the first four candles are a consolidation which could result in a reversal or a continuation, the second and final signal is the last candle which confirms that the bears are in control. It can form in the middle of a range, or at any point during a down trend, but gives off the strongest signals when it confirms resistance and/or a break of support.
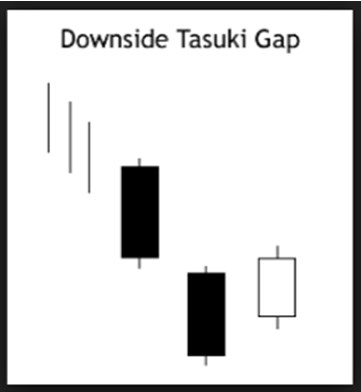
3. Downside Tatsuki Gap
This, like most patterns, has both a bullish and bearish version. In the bearish version a long black candle will form, signaling there is some strength in the move. A second black candle will follow, opening a gap from the first, confirming the strength of bearish sentiment. The confirming candle is in fact a rebound from the low of the second candle that will move up and try, I repeat TRY, to close the gap opened between the first and second candles. The confirmation comes with the close of the third candle; if the gap is not fully closed, or if it is only closed with upper shadow but not with the closing price of the third candle, you can be assured that the bears are still in control and that lower prices are coming within the next candle or two.
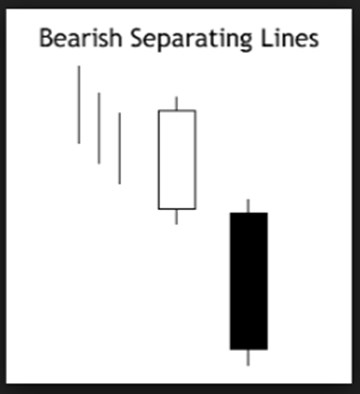
4. Bearish Separating Lines
The bearish separating lines are a pattern that require only 2 candles but nonetheless is very powerful. The signal occurs during an identified down trend and comes after a one candle retracement. The first candle will be a long white candle which forms during the downtrend, probably moving up from a support target or perhaps sparked by a news event. The second candle will be bearish, the longer and stronger the better, that opens below the open of the first candle and moves lower from there. This pattern can form at any point during a confirmed down trend but performs best when the down trend is nearing a potential bottom, not just potential support, as it is often caused when the bulls begin to give up hope of reversal.
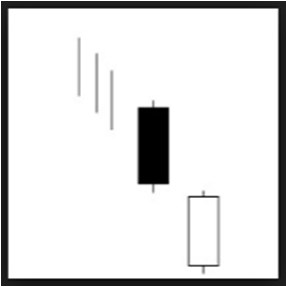
5. Bearish On-Neck Lines
The bearish on-neck lines is another great, reliable, continuation pattern. At first glance you may think it is the same as separating lines but no, take a closer look. The first candle will be a long black candle within a down trend. This signifies strength in the move if not outright continuation. The second candle will be a long white candle that opens with a gap and then moves up to close the gap but closes equal to or below the close of the first candle. The analysis is that prices gap down to a potential support, but support is not strong enough to overcome the bears, and leaves price vulnerable to further downside.
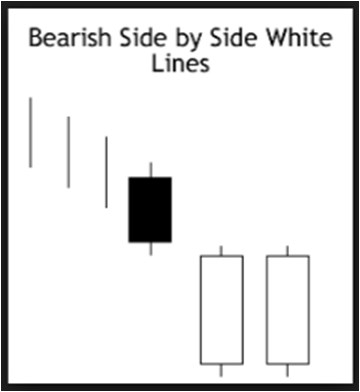
6. Bearish Side By Side White Lines
This is a continuation pattern you find listed in most books but what most of the books won’t tell you is that it is extremely rare. This is a three candle pattern that occurs in a down trend and is formed when prices gap lower at the open and then form two white lines with nearly identical opening and closing prices but do not close the gap. It is similar to the Bearish On-Neck Line but as mentioned, requires two white candles to form not just one. It is a sign that bulls are losing their grip on the market, are being overpowered by bears and will soon capitulate. As a continuation it is pretty accurate but in most cases come very near the bottom of a down trend and will usually lead to a reversal in the near to short term (depending on the time frame you are trading).
Further Reading On Japanese Candlestick Signals
- Bullish Continuation Patterns
- Bullish Reversal Signals
- Bearish Candlestick Reversal Signals
- Doji Candlestick Signals