Tool Review – Finding Trends with Andrews Pitchfork!
Andrews’ Pitchfork, A Devilish Tool For Binary Options Traders
Pitchforks aren’t only good for farming or hunting witches, you can use them to hunt for trends too! This analytical method was developed by an MIT graduate named Alan Hall Andrews, hence the name: Andrews’ Pitchfork. The tool is used for drawing parallel lines on the charts and identifying channels and retracement areas. Drawing the Pitchfork lines can be tricky for a newbie so I only recommend this tool for more advanced traders who feel comfortable with drawing regular trend lines.
What is the Andrews’ Pitchfork Tool?
Andrews’ Pitchfork already exists in MetaTrader 4. Simply go to Insert and look further down until you see “Andrews’ Pitchfork”. It consist of three parallel lines that create a channel of potential support and resistance areas. The middle line is supposed to be where price will “always” try to come back to, otherwise known as reversion.
This tool is very similar to the Linear Regression Channel tool. Actually, the line in the center is indeed a linear regression. As for the outer lines, price can break above or below one of them and then retrace back towards the middle line again. For that reason, one must be careful not to interpret every breakout as an actual trend reversal. You can see this in the picture below, notice how H2 candles close below the lower or upper line only to retrace back all the way back to the middle line!
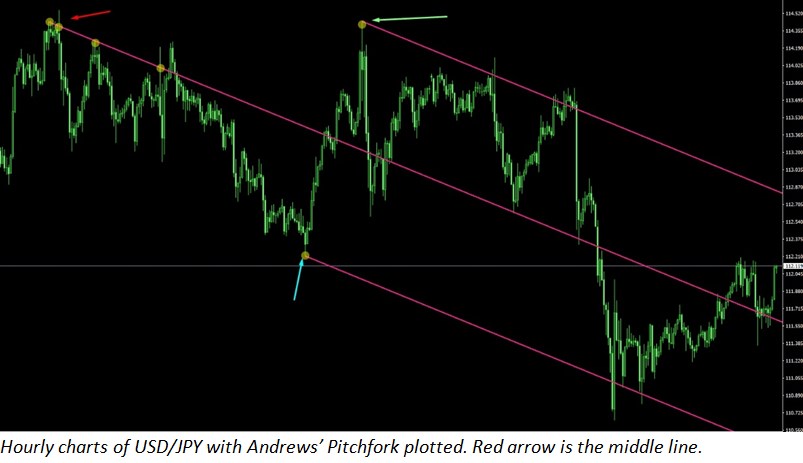
To plot a Pitchfork, the first thing you want to do is to find the end of a trend or the beginning of a new trend. In the case above, an uptrend had just ended and price was creating lower highs. The first three lower “peaks” give us the location for our middle line as marked by the red arrow. Next, you need to locate one “extreme” low and high, marked by the blue (low) and the green (high) arrow. Set your markers at these locations and Andrews’ Pitchfork tool will automatically draw three parallel lines for you.
From the picture you can tell that price has a tendency to come back to the middle line. At the far right, price has recently used the middle line as a support and is continuing up. Of course, this will not always be the case as any method of analysis is just based on probabilities and not certainties. There are a few other variations of how to draw Andrews’ Pitchfork but in my opinion, this is the easiest way to draw them. Finally, when it comes to accuracy, I have tested this tool on several timeframes, including M5, and it proved to be quite accurate even on such low timeframes!
Why Might Andrew’s Pitchfork Suck?
This tool might suck for beginners who lack the understanding of trends, highs and lows and basic price action. By itself, it will also give false signals because price will sometimes consolidate above or below one of the outer lines and give the impression of a possible breakout.
Why Andrew’s Pitchfork Doesn’t Suck?
If you are already good with drawing trend lines this tool is great for creating parallel channels to trade off of. It also respects price action and thanks to being a trend following tool, it will definitely minimize the number of losing trades and gives you good entries. When used with other analysis such as support/resistant or an oscillator like stochastic it becomes even more powerful.
Hunting Trades with Pitchforks!
Overall, trend analysis is a must for every trader and mastering trend lines will surely improve your results. Thanks to Andrews’ Pitchfork tool, you will know how to make proper line studies and finding better entries will become easier! For a complete beginner this tool may beg be super confusing so do a thorough study of trend analysis first, it took me a while to understand which three points to select for the Pitchfork and I have a lot of experience drawing trend lines. In conclusion, once you have plotted the lines properly, you will see how well they interact with the candlesticks and even intercept your support and resistance lines, giving you solid confirmations! You can absolutely create a solid strategy with this tool by adding one more indicator like an RSI, Stochastic Oscillator or any preferred indicator.