RSI Chart Bars for Binary Options – The Proof is in the Pudding
The Relative Strength Index has long been one of my favourite indicators, but lately we sort of “fell out of love” because I’ve been focusing more on other indicators. Yea, not too consistent from my part, but hey, we all make mistakes and get tempted by flashier indicators. Well, that’s that, but recently I’ve returned to my RSI due to an indicator I’ve found – RSI Chart Bars – which will be the focus of today’s article.
What are RSI Chart Bars and How to Use Them
Basically the RSI Chart Bars are just a Relative Strength Index displayed in a different way than we are used to: instead of showing it in the bottom window, the indicator colours the chart candles Blue when the RSI is above its 50 level and Red when the RSI is below the 50 level. The default setting of the indicator is RSI 55, which is very slow but it helps filter some of the noise. If the default setting of RSI 14 would be used, then you would not have many trading opportunities because the candles would change colour too often. Of course, you can try to adjust its settings to suit your needs: I use it as a trend indicator but you can use it differently. Let’s see it in action:
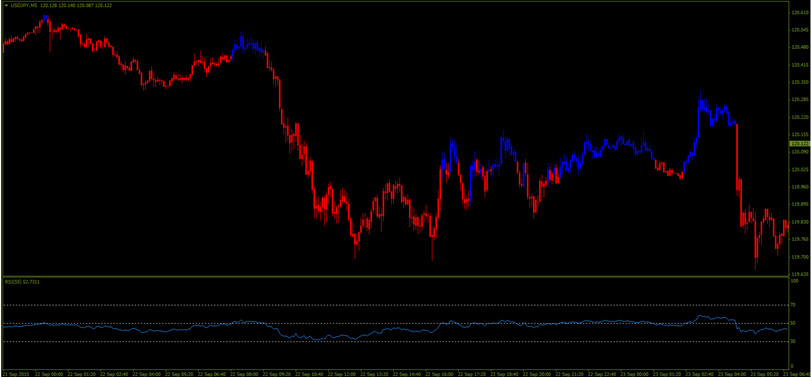
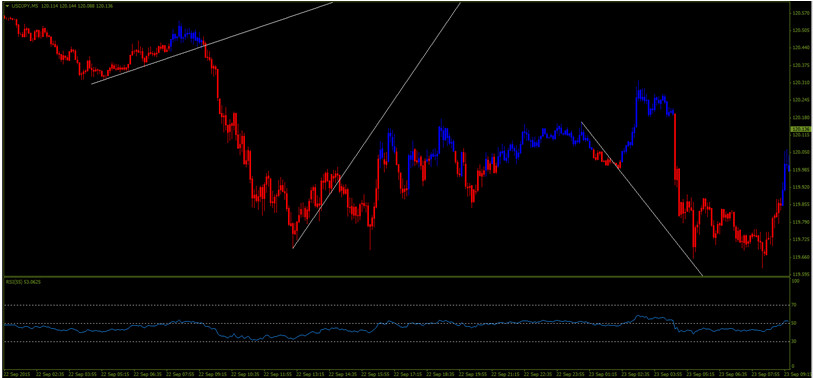
I’ve also placed a normal Relative Strength Index in the bottom window, just for you to see that when it crosses below the 50 level, the candles turn Red and when it goes above the 50 level, candles become Blue (remember the default setting is 55). Ok, so why don’t we use the classic RSI? Simply because to me the RSI Chart Bars are visually better and easier to look at. You have to remember that we are talking about a tool, not a complete strategy so you will have to find your own way of trading it. As I said, I use it to identify easier a trend and then look for retracements in that trend – moves against the main direction that give me a good entry point. These retracements can be identified in various ways and using a wide choice of indicators. You can also use the RSI Chart Bars to confirm a trend line break in the direction of the main trend:
You can use it in conjunction with an oscillator (MACD in this case):
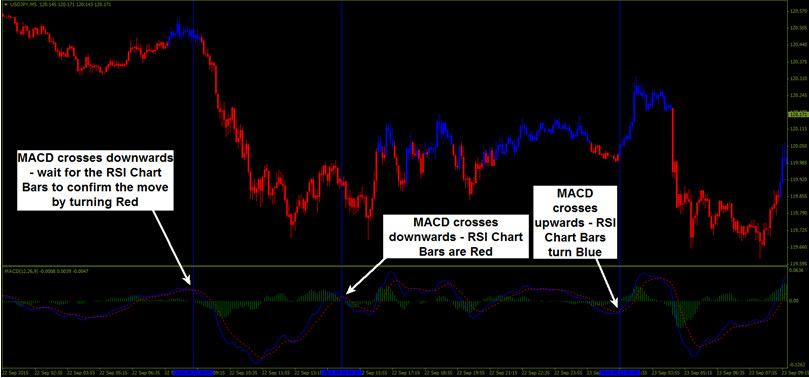
Basically, the RSI Chart Bars can be used to confirm a cross of an oscillator or a trend line break/bounce or in conjunction with your indicator of choice as an extra confirmation. Also, when I see them change colour often, I stay away from that pair because chances are that a ranging period is about to start.
Why the RSI Chart Bars don’t Suck?
They work great as a trend – retracement – continuation tool, but also, they open the door for an approach that might be appealing to short term traders – and I know there are plenty out there. Notice that usually when the bars change colour, price goes in that direction for at least a few candles, so this makes me think: why not go in the direction of the bars’ colour with a short term expiry of 3-4 candles? It might work if the move is also confirmed by say a MACD or a Stochastic, or at least a trend line. Anyway, the uses are many and ultimately it’s up to you to find the best one.
Why the RSI Chart Bars Suck?
Well, for one thing, they deny you the possibility to use the oscillator advantages of the RSI. You won’t see the highs and lows made by the indicator (I am talking about the classic RSI), thus you won’t be able to identify divergence. The Chart Bars overlay on top of price so there’s no way to use them as an oscillator. Of course, to counter that you could always use a normal RSI in the bottom window, or any other type of oscillator for that matter.
The Coloured Conclusion: Yay or Nay to RSI Chart Bars?
I say Yay, but that’s because I have used them during the recent period and I like how they fit in my overall system. I’ve always said that an indicator is not meant to be used alone and that it needs confirmation from others; the same is true for the RSI Chart Bars and I would never base my entire trading decisions only on this indicator. Even if by using this indicator, I lose the ability to see divergence between price and RSI, I can overcome that setback by finding divergence between price and other indicators (and if you are not a divergence trader, that’s not even an issue). Bottom line is: take it, slap it on a chart and decide if it’s of any help to you. If it is, buy a beer to the original coder when you see him or her.
Downloads Available: