Ichimoku Indicator for Binary Options Explained
The indicator I am going to talk about today is one of the most complicated and it’s often “feared” by traders because it’s hard to understand and it has too many lines which can give hard to read signals. However, I will try to give you a stripped down explanation, along with some deeper insights, and to show you just why I believe it’s important in making you a better trader.
Ichi Moku Kinko Hyo, translated as “one glance equilibrium chart”, is one of the trading secrets coming to us from Japan. It was released in the late 1960’s by journalist Goichi Hosada, after his use in covering the Japanese equity and futures markets. To be honest, it is a masterful piece of work. It makes use of four individual measures of price action that can be used as individual indicators or in combinations of 2,3 or 4 to create a powerful and complete trading system.
How to Use the Ichimoku Indicator?
The tool was developed in the late 1930 by a Japanese journalist named Goichi Hosoda. He spent the next 30 years perfecting the indicator before releasing it to the public so you can imagine the amount of work that went into this indicator. It is based on moving averages and it aims to offer a quick look at the state of the market: it shows if the chart is in equilibrium or not. Let’s get familiar with the components of the indicator. Take a look at the picture below:
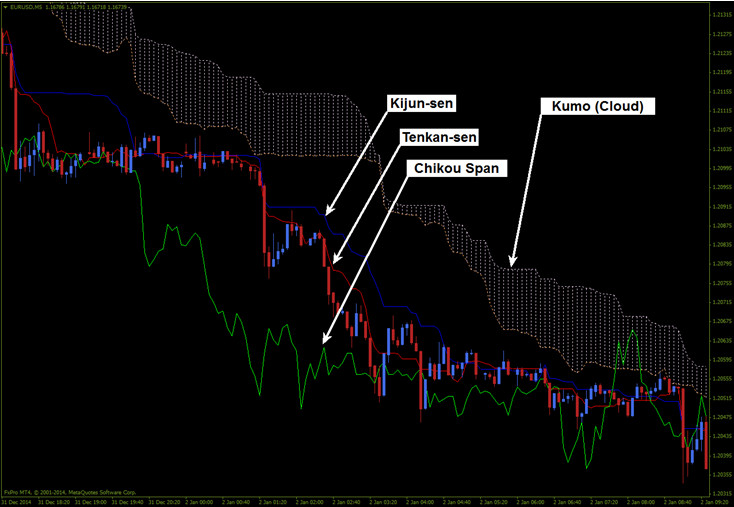
Tenkan – sen: This is the Red line on the chart, it has a 9 period setting by default and it’s the line that stays the closest to price.
Kijun – sen: The Blue line on the chart, with a default setting of 29 periods (notice that 9 and 26 are also the settings of the MACD).
Chikou Span: The Green line on our chart. This is the closing price of the most recent candle projected back 26 candles on the chart. It will always be behind price by 26 candles and acts as support and resistance.
Kumo: This is the Ichimoku Cloud and it is always projected 26 candles in front of current price. It acts as current support and resistance but also tries to predict where future S/R may be.
Four Parts Add Up To Super System
The four parts of the Ichi Moku are the Kijun Sen, the Tenken Sen and the Senku Span (which includes a forward and backward looking component bringing the total to four). The Kijun Sen and Tenken Sen are both a sort of Average True Range. Their formula is the highest high of period X – the lowest low of period X / by 2. In terms of our analysis, they represent momentum both short and medium term. The Tenken Sen is typically set to 9, short term, and the Kijun Sen to 26, medium term (these are the same settings for standard MACD, coincidence? I think not). They can be used separately like moving averages to signal price action crossover signals or together like an advanced moving average strategy or MACD indicator for signal line crossovers. In the basic sense, if one of the lines is moving up the momentum for that time frame is bullish so bullish crossovers are a good signal to take. When used together look for crossovers of the two lines, the Tenken-Kijun Crossover, as well as price action crossovers to confirm trends and indicate stronger signals.
The Senku Span, otherwise known as the cloud or the Ichi Moku Cloud, is a simple calculation with immense implications. The two lines can be used separately or together, together is recommended, and represent support and resistance in a dynamic fashion. Span A is the sum of the Tenken and Kijun line divided by 2, Span B is the sum of the highest high and the lowest low of the past 52 periods, also divided by 2. Together they create an indicator that acts like a pair of moving averages and a Bollinger Band style volatility indicator. When price action is above the cloud it will act as a support target which ACCOUNTS FOR VOLATILITY. When price action is below the cloud it will act as resistance in just the same way; support may be found anywhere within the cloud, a break through the cloud indicates a strong change of direction. While price action is within the cloud the upper and lower edges may act as internal support and resistance, holding prices range bound.
Putting it all together, connecting the dots for a picture of profits, is not as hard as it may first have seemed. I am sure by now even the rankest newbies reading this are having thoughts of how to use the cloud to indicate trend, momentum, support and resistance while using the Tenken-Kijun Cross to pinpoint entries. In terms of analysis and trade decisions, start with the cloud. Is price action above, below or within? If within is it maybe crossing up or down? Looking at the two spans, Span A and Span B, is it widening or narrowing? Is price action moving away or moving toward?
How To Trade The Ichi Moku Cloud
So, we’ve discussed the elements of the Ichimoku, now let’s see how to make use of them in trading. The Cloud offers Support and Resistance but it also shows you clearly if the market is in a downtrend, an uptrend or if it’s moving sideways (ranging). If price is below the Cloud, just like in my picture above, then the market is in a downtrend. Price above the cloud suggests the market is in an uptrend and when price is inside the Cloud, the market is ranging. The Cloud is the main thing I use when it comes to Ichimoku; to be honest I deleted the Green line (set its color to “none” so it doesn’t show on the chart) and for some strategies I do the same with the Blue and Red. I am not saying these lines are not important, just that for my strategies I don’t use them. But anyway, let’s get trading: when price is below the Cloud, we are in a downtrend so we will be only looking for Puts. A Put signal is generated when Red goes below Blue:
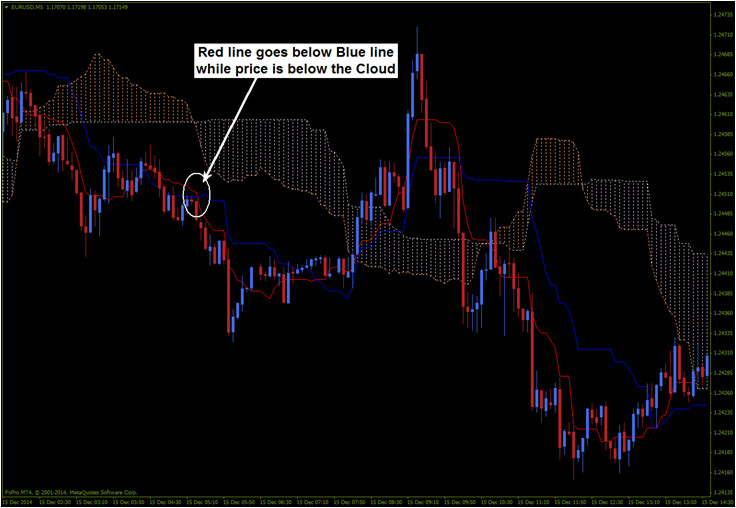
For a Call price must be above the Cloud and the Red line to cross above the Blue. As you can see from my pictures above, the signals can be kind of hard to read and sometimes come too late for Binary Options; that’s why I use different indicators combined with the Ichimoku Cloud, without looking at the other lines. Keep in mind that this explanation about the Ichimoku is very basic and it doesn’t cover all aspects.
Ichi Moku Video Explainer
Why does Ichimoku Suck?
I believe that you cannot just pick up Ichimoku, read an article about it and start trading it successfully because it is a very complex indicator which has a lot of different ways of use. Like I said above, sometimes the cross of the Red and Blue lines comes too late and price reverses before your option expires and sometimes price goes to one side of the Cloud and then reverses, without establishing a clear trend.
Why the Ichimoku doesn’t Suck?
If you use it long enough you will understand it better and you will see that price reacts when it meets the Cloud. Because the Cloud is projected ahead of price, you can also get an idea of how price will move in the future. Of course, nobody knows the future and I am not saying that Ichimoku is your Crystal Ball but after all, our trades are predictions, we try to predict where price will be at expiry time, so any help we can get with this prediction is appreciated. I also like it because it is a great all in one system using momentum, price action, dynamic support/resistance and trend to determine proper entries.
The Cloudy Conclusion
I don’t expect you to love this indicator right from the start but I think you need to give it a chance. Put it on a chart and try to incorporate it in your current strategy and see if it helps in any way. Black out all the other lines and just use the Cloud, or leave them all on your charts; do what’s comfortable for you and what you think can generate more In the Money trades.
The bottom line is that this is a great tool. It incorporates long and short term indicators, momentum, volatility, support and resistance into an easy to read system any trader should be able to pick up. What I like about it is that you really don’t need anything else, it is truly a stand alone full service trading system. If you have any questions you can find us in the forum, talking about Ichi Moku and everything else trading.