Jensen’s Alpha Indicator – The MACD Alternative
Jensen’s Alpha, or so-called the Jensen Index, is an indicator that measures the risk to reward ratio of an asset. The man behind this tool is Michael Jensen, an American economist. He developed Jensen’s Alpha back in the 80’s which was first intended to measure how well fund managers performed. Today, it is used for guiding investors before they invest in certain assets. Jensen’s Alpha measures whether the risk is worth the reward and is a very complex indicator to master. There is obviously some math behind it, the part that you need to understand is quite simple. The main question however, is whether it works for binary options or not?
What is Jensen’s Alpha Indicator?
Jensen’s measuring system can be used in two ways. In an excel sheet or as a histogram in your charts. The latter is the relevant part for us binary options traders and the one I’ll address in this review.
Simply put; the purpose of this indicator is to signal if a security (a stock) is performing well or not but also gives investors a hint about the trend. This indicator does not exist in MetaTrader’s indicator list so it has to be manually installed. (More on this in the conclusion part below).
Now let’s view the formula for calculating Jensen’s Alpha:
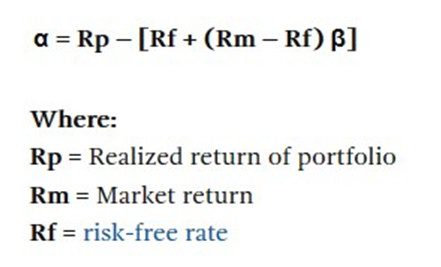
The alpha (α) is reported in percentage and it can be either negative or positive. To explain this equation in a simpler way we mainly focus on the alpha itself. The idea is to adjust your risk (β) in accordance with the potential reward. As an investor, you want to find out whether the risk you are going to take when you invest in an asset is worth the return. To be worth it, you need the alpha to be positive. The higher this positive value is, the better the performance of that asset been. Vice versa is true when the alpha has a lower negative value. Unfortunately, this indicator can give false signals, sometimes alpha can have a positive value while the stock in question is still performing poorly – or the other way around.
The Histogram
Jensen’s Alpha histogram indicator can be used on the charts for the determination of the alpha value. In the picture below you can see how it looks once inserted on a chart (daily chart in this case). The red areas indicate that alpha has been negative for that period of time and the green areas show a positive alpha. By analyzing various time frames you can find out how an asset has performed over a certain period of time and if there is a possibility of a trend reversal. For example; the daily chart might contain some recent green areas in the histogram while the weekly chart might only contain red areas. This could be an indication of a trend reversal but it has to be confirmed with the use of other analysis and indicators. There are no specific signals to mention but green equals good performance so it equals an uptrend and red means downtrend because the asset is performing poorly.
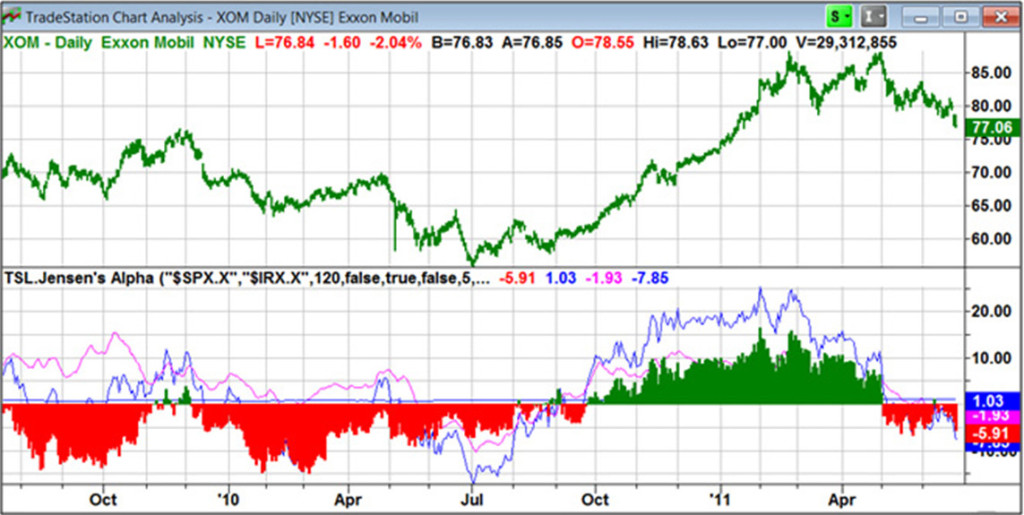
Image Source: https://www.tradestation.com/
The red areas indicate a negative Alpha and the green area is positive Alpha. For more pictures and deeper explanation, click the link above.
Why does Jensen’s Alpha Suck?
My first issue is that the only two places I could find this indicator was at tradestation.com and thinkorswim.com and you need to register in order to use their charts. Another rather not so desirable fact is that this tool is mostly created for determining whether you should invest in stocks or not, which isn’t really that relevant to all of us binary options traders who trade other assets. Bottom line, it doesn’t give signals, just an indication if the trend may be up, or may be down.
Why doesn’t Jensen’s Alpha Suck?
The part about Jensen’s Alpha being able to predict a potential trend reversal is something binary options traders can use and that doesn’t suck. Binary options traders that trade stocks can benefit from this indicator as well because they can place put options when alpha is negative and call options when it’s positive and as such is a decent trend indicator system.
Conclusion – Jensen’s Alpha for Alpha Traders?
Since I had no luck in getting my hands on this indicator to test it I can’t tell you how it performs on lower time frames and other assets than stocks. However, while looking at the picture above, I noticed that something looked very familiar! Guess what, Jensen’s Alpha histogram looks similar to MACD. So why go through the trouble of finding and installing an indicator that is quite intricate to understand for the average Joe? I mean, they both tell you about trends but MACD is already preinstalled, reliable, well-explained and very very useful to binary traders. MACD works on currency pairs as well as other assets. If you still want to try Jensen’s Alpha and you manage to find it, let us know! Thanks.